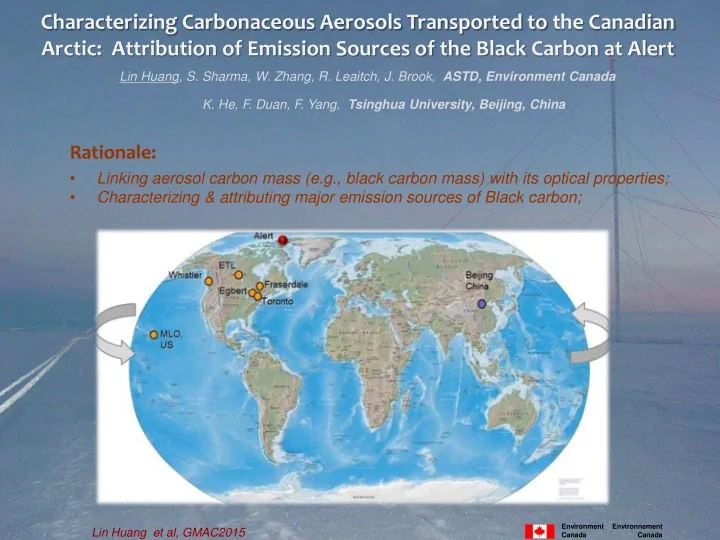

Characterizing Carbonaceous Aerosols Transported to the Canadian Arctic: Attribution of Emission Sources of the Black Carbon at Alert Lin Huang, S. Sharma, W. Zhang, R. Leaitch, J. Brook, ASTD, Environment Canada K. He, F. Duan, F. Yang, Tsinghua University, Beijing, China Rationale: • Linking aerosol carbon mass (e.g., black carbon mass) with its optical properties; • Characterizing & attributing major emission sources of Black carbon; Page 1 Environment Environnement Lin Huang et al, GMAC2015 Canada Canada
M easurements at Alert ( WMO_GAW Observatory ) Bi-weekly/weekly integrated quartz filers collected for - Elemental carbon (BC mass) and organic carbon contents - Related C isotopic compositions In Situ measurements of light absorption coefficient (eBC) - Hourly and weekly averaged values can be derived Environment Environnement Lin Huang et al, GMAC2015 Canada Canada
Elemental Carbon ( BC mass) & light absorption ( BC optical property) at Alert Environment Environnement Lin Huang et al, GMAC2015 Canada Canada
Inter-Annual Variation of Mass Absorption Coefficient (MAC) at Alert MAC = σ ap /C (absorption per unit BC mass) • MAC values during winter-spring seasons were pretty much constant as well as independent on particle size Modeled MAC BC (at 550 nm) for uncoated sphere: 6.4 m 2 /g, Adachi et al. [2010] Page 4 Environment Environnement Lin Huang et al, GMAC2015 Canada Canada
Elemental Carbon (BC mass) Measurements at Alert in comparison with the measurements at Beijing Environment Environnement Lin Huang et al, GMAC2015 Canada Canada
δ 13 C values of Possible Sources ~ - 5 ‰ of Carbonaceous PM in Mantle Carbon ~ 0 ‰ the Earth System Carbonates (soil or sea salt) ~ - 12 ‰ Biomass burning C 4 Plants ~ - 26 ‰ C 3 Plants ~ - 24 ‰ ~ - 40 ‰ ~ - 28 ‰ Fossil fuels Global & Regional 3 FF Consumptions* & the mean δ 13 C Values (*data source: http://cdiac.ornl.gov/trends/emis/overview for 2006 ) North America (-29.3 ‰) Euro-Rus (-31.2 ‰) Asia (-26.1 ‰) δ 13 C of FF Gas (-40 ‰) Global (-28.6 ‰) Liq_fuel_D+G (-28 ‰) Coal (-24 ‰) Russia (-32.9 ‰) China (-25.0 ‰) Environment Environnement Lin Huang et al, GMAC2015 Canada Canada
δ 13 C values of Possible Sources ~ - 5 ‰ of Carbonaceous PM in Mantle Carbon ~ 0 ‰ the Earth System Carbonates (soil or sea salt) ~ - 12 ‰ Biomass burning C 4 Plants ~ - 26 ‰ C 3 Plants ~ - 24 ‰ ~ - 40 ‰ ~ - 28 ‰ Fossil fuels North America (-26.2 ‰) Euro-Rus (-26.2 ‰) Asia (-25.2 ‰) δ 13 C of FF Liq_fuel_D+G (-28 ‰) Global (-25.9 ‰) Coal (-24 ‰) Russia (-25.7 ‰) China (-24.7 ‰) Environment Environnement Lin Huang et al, GMAC2015 Canada Canada
Seasonal Variations of mean BC mass and its δ 13 C at Alert Anti-correlation between δ 13 C and BC mass in seasonal variation; • Relatively negative values (< -28 permil) in δ 13 C during winter-spring seasons, suggesting that gas flaring • contributions to the BC are important at the Canadian arctic 2006-2013 Page 8 Environment Environnement Lin Huang et al, GMAC2015 Canada Canada
Seasonal Variations of means in δ 13 C of Elemental Carbon (Alert, Canada vs. Beijing, China) • Opposite seasonal patterns in δ 13 C at Alert & Beijing suggests that the aerosol BC transported to the Canadian arctic is not significantly influenced by the emissions sources from East Asia Page 9 Environment Environnement Lin Huang et al, GMAC2015 Canada Canada
Inter-annual Changes of Seasonal means in δ 13 C of “BC” mass at Alert (vs. Beijing, China) Changes in δ 13 C EC leaning toward more positive values during winter-spring seasons at Alert are observed; • • Satellite observations suggest that decreasing in gas flaring likely contributes to the changes; • 14 C measurements need to be done to further confirm biomass burning /bio-fuel contributions Year Page 10 Environment Environnement Lin Huang et al, GMAC2015 Canada Canada
Source: NOAA satellite data; NOAA is currently processing 2013 data and working to calibrate the data to derive estimates of flare volumes. However, a number of circumstances, including the use of new VIIRS infrared technology for more accuracy, have delayed the process. The World Bank-led Global Gas Flaring Reduction Partnership and NOAA are working to make 2013 gas flare volume estimates available as soon as possible . World Bank Group (http://www.worldbank.org/en/news/feature/2014/09/22/initiative-to-reduce-global-gas-flaring) Environment Environnement Lin Huang et al, GMAC2015 Canada Canada
Photo by L Huang, 2004 Summary Opposite seasonal patterns in δ 13 C at Alert & Beijing suggests that the surface aerosol BC transported to the Canadian arctic is not significantly influenced by the emissions sources from East Asia; Changes in δ 13 C leaning toward more positive values during winter-spring seasons could be caused by either decreasing the fraction with relatively negative δ 13 C values (e.g., gas flaring) or increasing the fraction with relatively positive δ 13 C values (e.g. coal combustion or biomass burning); Satellite observations suggest that gas flaring activities in Russia, Kazakhstan and some other previous Soviet-Union countries have been decreased by ~ 30%, which may explain the positive trend in δ 13 C; The inter-annual variation of Mass Absorption Coefficient (MAC) & Absorption Angstrom Exponent (AAE) suggest that not much has been changed in optical properties over the period (2007-2011) and that the fraction of biomass burning contribution has not likely increased (no increasing trend in AAE observed). 14 C measurements need to be done to further confirm biomass burning contribution . Environment Environnement Lin Huang et al, GMAC2015 Canada Canada
Photo from the CO of the base at Alert, 2004
Elemental Carbon Contents at Alert vs. Fossil Fuel Consumption (2004 - 2012) Environment Environnement Lin Huang et al, GMAC2015 Canada Canada
Inter-Annual Variation of A bsorption A ngstrom Exponent at Alert Å abs = - {Log [MAC( λ1) / MAC( λ2 )] / Log( λ1/λ2 )} Environment Environnement Lin Huang et al, GMAC2015 Canada Canada
Recommend
More recommend