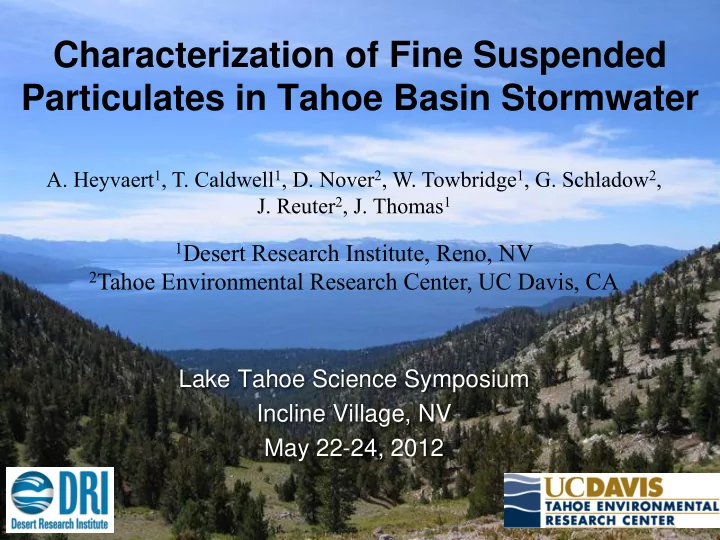

Characterization of Fine Suspended Particulates in Tahoe Basin Stormwater A. Heyvaert 1 , T. Caldwell 1 , D. Nover 2 , W. Towbridge 1 , G. Schladow 2 , J. Reuter 2 , J. Thomas 1 1 Desert Research Institute, Reno, NV 2 Tahoe Environmental Research Center, UC Davis, CA Lake Tahoe Science Symposium Incline Village, NV May 22-24, 2012
UCD-TERC Profile of Lake Clarity Change Over Time
Partitioning of Light Attenuation in Lake Tahoe Swift, T.J., J. Perez-Losada, S.G. Schladow, J.E. Reuter, A.D. Jassby, C.R. Goldman. 2001. Limnol. Oceanogr.
Particle Settling Times to Average Lake Depth (313 m)
Cumulative Contributions to Light Scattering in Lake Tahoe by Inorganic Particle Size Class (adapted from Swift et al. 2006)
Tahoe Basin SWM Monitoring Sites Regional TMDL stormwater monitoring consisted of continuous flow meters, precipitation sensors, and autosamplers.
FSP Loading by Source Categories Fine Sediment Particles (FSP) (< 16 microns) Atmospheric Shoreline Deposition Erosion (<1%) 15% Stream Channel Erosion 4% Non-Urban Upland Urban Upland 9% 72% TMDL Technical Report (2010)
Examples of Fine Particle Loading from Urban Runoff (Photos by Collin Strasenburgh)
Median PSD Profiles from All SWM Sites Over seven hundred samples were collected and analyzed at these fifteen sites from WY2003 thru WY2009 (Heyvaert et al. 2011).
Compare these Median PSD Profiles Median PSD profiles for two sites at opposite ends of the Tahoe Basin. The MD profile is shown for comparison. Size class midpoints are the same for each site.
Median and Interquartile Range for PSD Profile Characteristic PSD profile derived from all Tahoe stormwater samples (n=773).
Calculation of Particle Numbers FSP conc = ∑ Φ conc (summing from φ=6 through φ=11) Where: Φ conc = phi interval concentration, reported as the concentration of particles per unit volume (#/mL) between successive phi (φ) grain -size units (the series can also be in half-phi units or finer); phi (φ) is the logarithmic unit of grain size, such that φ = −log 2 [d(mm) / 1.0 (mm)]; and d(mm) = spherical equivalent particle diameter, in millimeters.
Calculation of Particle Numbers Φ conc = P vol • SP conc • 6/π • d -3 • ρ -1 • CF Where: P vol = particle volume percentage (of total) within designated phi interval; SP conc = suspended particulate concentration (mg/L) measured in the sample (usually reported as TSS, or a fraction thereof); d = representative phi interval particle diameter (µm); ρ = mean particle density within designated phi interval (g/cm 3 ); CF = conversion factor (10 4 when using the units indicated above). Heyvaert et al. (2011)
Cumulative FSP Concentrations Typical samples from SB site, showing cumulative total particle concentrations are essentially constant in the larger particle size categories.
Cumulative FSP Concentrations Typical samples from SB site, showing cumulative total particle concentrations are essentially constant in the larger particle size categories.
FSP Concentration versus Turbidity Total particles between 0.5 to 16 µm in Tahoe stormwater samples versus turbidity (n=773) calculated from LS-13320 data.
Prediction Interval for FSP from Turbidity 8 Sample at 100 NTU predicted to yield (at 95% FSP conc. (log 10 (#/mL)) confidence) a 7 measured FSP concentration somewhere between 2.4E+06 6 and 3.3E+07 particles per mL (centered at 5 8.93x10 6 particles per mL). 1 2 3 Turbidity (log 10 (NTU)) Based on sample turbidity plotted within a log-log data frame.
Holding Time Effect (Exp 1) Effect of holding time on a typical Tahoe stormwater sample. Each curve is the mean of 5 replicate sample splits held for the time indicated at 4 ° C in the dark and analyzed without dispersant or sonication. All 15 replicates were split from one parent sample at the same time.
Holding Time Effect (Exp 2) Effect of holding time on a typical Tahoe stormwater sample. Each point is the median of 3 replicate sample splits held for the time indicated at 4 ° C in the dark and analyzed without dispersant or sonication. All 33 replicates were split from one parent sample at the same time.
Testing Sonication Time Dashed black line indicates particle size distribution at time of sample collection (<0.5 hr). In this case, the profile indicates that a sonication setting of ~ 90 seconds appears to best reproduce the original PSD. All points represent the average results from three replicate split samples. Examining graphs of the d50 particle size and other distribution characteristics show similar results.
Comparative PSD Analysis Scatterplots of selected samples analyzed by two different LBS instruments, the LS-13320 and the DigiSizer LPSA instruments.
General Conclusions • An urban stormwater characteristic PSD profile has been developed, showing a unimodal peak at ~ 20 µm. • A strong relationship was was observed between stormwater sample turbidity and FSP concentration (total 0.5-16 µm particles/mL). • An equation was developed for estimating FSP concentrations from sample turbidity measurements. • Changes in PSD associated with holding times for stormwater samples were evident within a single day, tending toward increasing particle size, a process that continued with increased holding times. • Treatment with sonication was generally effective at restoring characteristics of the original sample PSD, but more info needed. • Sample particle mass and turbidity measurements are strongly recommended (ASAP). These can be used to recalibrate as methods are improved.
Thank you, and questions…. This project was made possible by funding from the Southern Nevada Public Land Management Act (SNPLMA) through a grant administered by the USDA Forest Service Pacific Southwest Research Station.
Thank you, and questions…. This project was made possible by funding from the Southern Nevada Public Land Management Act (SNPLMA) through a grant administered by the USDA Forest Service Pacific Southwest Research Station. Heyvaert, A., D. Nover, T. Caldwell, W. Trowbridge, G. Schladow, and J. Reuter. 2011. Assessment of Particle Size Analysis in the Lake Tahoe Basin. Final Report. Desert Research Institute, Reno, NV, and University of California, Davis, CA. February 2011.
Recommend
More recommend