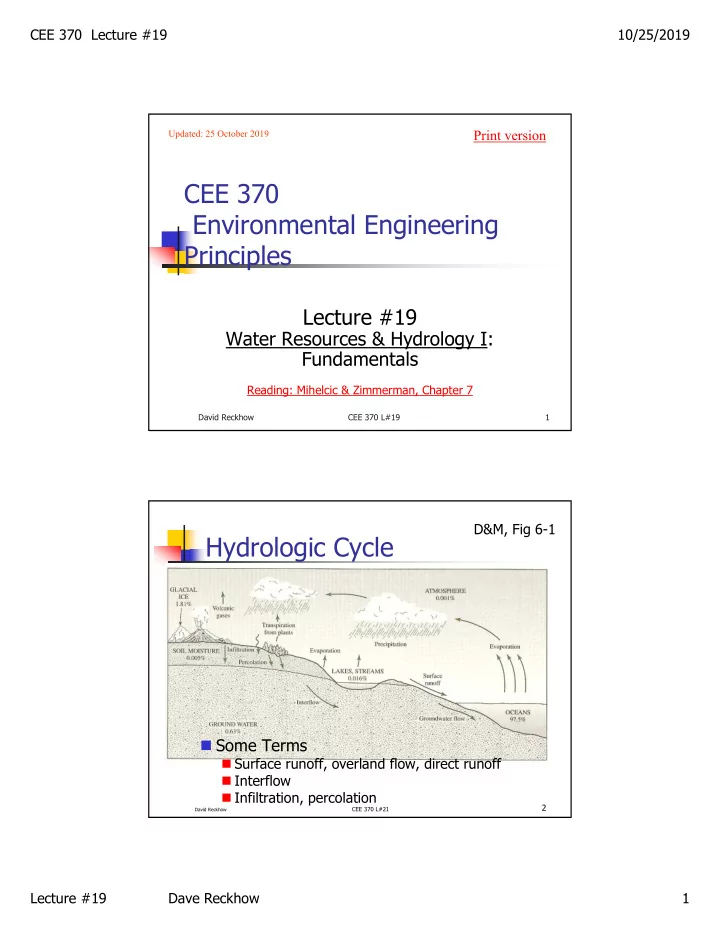

CEE 370 Lecture #19 10/25/2019 Print version Updated: 25 October 2019 CEE 370 Environmental Engineering Principles Lecture #19 Water Resources & Hydrology I: Fundamentals Reading: Mihelcic & Zimmerman, Chapter 7 David Reckhow CEE 370 L#19 1 D&M, Fig 6-1 Hydrologic Cycle Some Terms Surface runoff, overland flow, direct runoff Interflow Infiltration, percolation 2 CEE 370 L#21 David Reckhow Lecture #19 Dave Reckhow 1
CEE 370 Lecture #19 10/25/2019 Beneficial uses of water Drinking, cooking, Home Use bathing, cleaning, ~200 gal/cap/day waste disposal Power Plants ~800 gal/cap/day Industry ~200 gal/cap/day Agriculture ~600 gal/cap/day Swimming, boating, Recreation fishing, etc. 3 CEE 370 L#21 David Reckhow Drinking Waters About 20% of all community water systems in the US use surface water; the remaining 80% uses groundwater. However, the surface water systems tend to be much larger, so that the population served by surface water sources is about two-thirds of the total. Community water systems serve about 83% of the total US population. Most of these employ some form of treatment to make the water microbiologically and chemically safe. 4 CEE 370 L#21 David Reckhow Lecture #19 Dave Reckhow 2
CEE 370 Lecture #19 10/25/2019 Shown earlier in the course Global Water Balance Showing global mass fluxes In 10 12 m 3 /yr Fig. 5.3 in Masters, Compare with Fig. 6.1 in D&M; Fig. 5- 27 in Mihelcic Fig 7.1 in M&Z 5 CEE 370 L#21 David Reckhow Shown earlier in the course Local Water Balance Change in storage = inputs – outputs dS P R E I dt Where: S = storage P = precipitation rate E = evapotranspiration rate Includes transpiration from plants and direct evaporation from water bodies, soil, etc. R = runoff rate I = infiltration rate (or leachate for a landfill) 6 CEE 370 L#21 David Reckhow Lecture #19 Dave Reckhow 3
CEE 370 Lecture #19 10/25/2019 What is average annual rainfall in Amherst? A. 15-20 in B. 20-25 in C. 25-30 in D. 30-35 in E. >35 in 7 CEE 370 L#19 David Reckhow California Source: Forbes 8 CEE 370 L#19 David Reckhow Lecture #19 Dave Reckhow 4
CEE 370 Lecture #19 10/25/2019 Local water balance Annual Water budget for Puerto Rico From USGS site: http://pr.water.usgs.gov/public/water_use/water_balance.html 9 CEE 370 L#21 David Reckhow Puerto Rico (cont.) In this case, the USGS includes coastal aquifers within the “control volume” for the mass balance, so: dS P R E I dt Becomes: dS P R E GW GW W D dt Where groundwater withdrawals (GW W ) and groundwater discharge (GW D ) are two loss processes from the aquifers And now: in in in in in in 1 72 23 46 1 1 yr yr yr yr yr yr 10 CEE 370 L#21 David Reckhow Lecture #19 Dave Reckhow 5
CEE 370 Lecture #19 10/25/2019 Example 1 (start) 11 CEE 370 L#21 David Reckhow 12 CEE 370 L#21 David Reckhow Lecture #19 Dave Reckhow 6
CEE 370 Lecture #19 10/25/2019 Example 1 (conclusion) 13 CEE 370 L#21 David Reckhow D&M, Fig 7-2 Drainage Basins Kankakee River basin above Davis, IN Dashed line is the basin “divide” Water that falls on one side eventually flows into the Kankakee Water that falls on the other side goes outside the basin 14 CEE 370 L#21 David Reckhow Lecture #19 Dave Reckhow 7
CEE 370 Lecture #19 10/25/2019 Effect of development 15 CEE 370 L#21 David Reckhow 16 CEE 370 L#21 David Reckhow Lecture #19 Dave Reckhow 8
CEE 370 Lecture #19 10/25/2019 Rational Formula Q = C ٭ I ٭ A Simplified view of runoff; no time resolution Runoff is some fraction of the total rainfall The fraction is the runoff coefficient R = C ٭ P Precipitation (in) Runoff Coefficient Runoff (in) 6 2 Q C I A 1 hr 10 m 1 m Basin Area (km 2 ) 3600 s 2 100 cm km Streamflow (m 3 /s) Rainfall intensity (cm/hr) 17 CEE 370 L#21 David Reckhow Hydrologic Soil Group Land Use, Crop, and Management A B C D CULTIVATED, with crop rotations Row Crops, poor management .55 .65 .70 .75 Row Crops, conservation mgmt .50 .55 .65 .70 Small Grains, poor management .35 .40 .45 .50 Small Grains, conservation mgmt .20 .22 .25 .30 Meadow .30 .35 .40 .45 PASTURE, permanent w/moderate grazing .10 .20 .25 .30 WOODS, permanent, mature, no grazing .06 .13 .16 .20 Urban residential 30 percent of area impervious .30 .40 .45 .50 70 percent of area impervious .50 .60 .70 .80 Hydrologic Soil Group Descriptions: A -- Well-drained sand and gravel; high permeability. B -- Moderate to well-drained; moderately fine to moderately coarse texture; moderate permeability. C -- Poor to moderately well-drained; moderately fine to fine texture; slow permeability. D -- Poorly drained, clay soils with high swelling potential, permanent high water table, 18 claypan, or shallow soils over nearly impervious layer(s). CEE 370 L#21 David Reckhow Lecture #19 Dave Reckhow 9
CEE 370 Lecture #19 10/25/2019 CT River: one year 19 CEE 370 L#21 David Reckhow CT River: Multi-year Annual flow patterns 20 CEE 370 L#21 David Reckhow Lecture #19 Dave Reckhow 10
CEE 370 Lecture #19 10/25/2019 Frio River Ephemeral Texas 631 mi 2 drainage basin 21 CEE 370 L#21 David Reckhow East River Dominated by Snowmelt Colorado 289 mi 2 drainage area 22 CEE 370 L#21 David Reckhow Lecture #19 Dave Reckhow 11
CEE 370 Lecture #19 10/25/2019 Suwanee River Spring Rains Georgia 1260 mi 2 drainage area 23 CEE 370 L#21 David Reckhow Example 2 24 CEE 370 L#21 David Reckhow Lecture #19 Dave Reckhow 12
CEE 370 Lecture #19 10/25/2019 25 CEE 370 L#21 David Reckhow 26 CEE 370 L#21 David Reckhow Lecture #19 Dave Reckhow 13
CEE 370 Lecture #19 10/25/2019 To next lecture 27 CEE 370 L#19 David Reckhow Lecture #19 Dave Reckhow 14
Recommend
More recommend