CEE 370 Environmental Engineering Principles Lecture #26 Water - PDF document
CEE 370 Lecture #26 11/8/2019 Print version Updated: 8 November 2019 CEE 370 Environmental Engineering Principles Lecture #26 Water Quality Management IV: Estuaries & Oceans Reading: Mihelcic & Zimmerman, Chapter 7 Reading: Davis
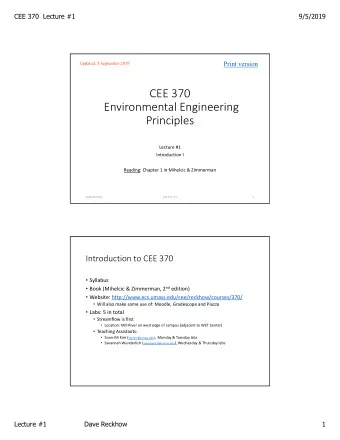
CEE 370 Lecture #26 11/8/2019 Print version Updated: 8 November 2019 CEE 370 Environmental Engineering Principles Lecture #26 Water Quality Management IV: Estuaries & Oceans Reading: Mihelcic & Zimmerman, Chapter 7 Reading: Davis & Cornwall, Chapt 5-5 to 5-6 Reading: Davis & Masten, Chapter 9-5 to 9-6 David Reckhow CEE 370 L#26 1 Combined sewer overflows CSOs Intended to protect wastewater systems from high flows A major source of contamination in many surface waters Pg 72, from Fair & Geyer, 1954 2 CEE 370 L#26 David Reckhow Lecture #26 Dave Reckhow 1
CEE 370 Lecture #26 11/8/2019 Combined Sewer Overflows Most CSOs are in the Northeast 3 CEE 370 L#26 David Reckhow Combined Sewer Overflows City # outfalls Boston 66 Cambridge 13 Chelsea 5 Fall River 19 City # outfalls Fitchburg 27 Agawam 12 Gloucester 4 Chicopee 40 Haverhill 23 Erving 1 Lawrence 2 Holyoke 15 Lowell 15 Ludlow 5 Lynn 4 Montague 3 New Bedford 39 Palmer 26 Somerville 12 South Hadley 11 Taunton 1 Springfield 25 Worcester 1 4 CEE 370 L#26 David Reckhow Lecture #26 Dave Reckhow 2
CEE 370 Lecture #26 11/8/2019 Hypoxia in the Gulf of Mexico 5 CEE 370 L#26 David Reckhow 6 CEE 370 L#26 David Reckhow Lecture #26 Dave Reckhow 3
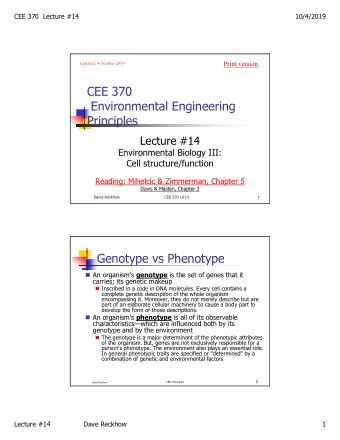
CEE 370 Lecture #26 11/8/2019 7 CEE 370 L#26 David Reckhow 4 Disciplines Geological Oceanography Structure of the sea floor Chemical Oceanography Chemical composition and properties of seawater Physical Oceanography Waves, tides, currents Biological Oceanography Oceanic life forms 8 CEE 370 L#26 David Reckhow Lecture #26 Dave Reckhow 4
CEE 370 Lecture #26 11/8/2019 Physical Characteristics of the Oceans Sea Area Volume Depth (m) (10 6 km 2 ) (10 6 km 3 ) ave max Pacific 181 714 3,940 11,022 Atlantic 107 351 3,293 9,219 Indian 74 285 3,870 7,400 Total 362 1350 3,729 11,022 Chemical Oceanography 9 CEE 370 L#26 David Reckhow Regional Oceanography Jordan Basin George’s Basin Wilkinson Basin George’s Bank 10 CEE 370 L#26 David Reckhow Lecture #26 Dave Reckhow 5
CEE 370 Lecture #26 11/8/2019 Composition of sea water From Johnson et al., 2000 11 CEE 370 L#26 David Reckhow Sediment Types Chemical Oceanography 12 CEE 370 L#26 David Reckhow Lecture #26 Dave Reckhow 6
CEE 370 Lecture #26 11/8/2019 Descriptive Oceanography Distribution of t, S and density Currents in the World Oceans Water Masses in the Oceans Use of Chemical Tracers 14 C, Tritium, 3 He, CFC Age of Water Masses The Ocean Conveyor Belt Chemical Oceanography 13 CEE 370 L#26 David Reckhow Surface Temperatures Chemical Oceanography 14 CEE 370 L#26 David Reckhow Lecture #26 Dave Reckhow 7
CEE 370 Lecture #26 11/8/2019 Temperature Distribution Solar Radiation Waters are colder in Polar regions Waters are warmer in Equatorial Regions Upwelling Waters are colder off the Western Coasts of continents Chemical Oceanography 15 CEE 370 L#26 David Reckhow Temperature Depth Profiles Seasonal: North Atlantic Winter Spring Summer Fall 16 CEE 370 L#26 David Reckhow Lecture #26 Dave Reckhow 8
CEE 370 Lecture #26 11/8/2019 Temperature Profiles -5 0 5 10 20 0 10 0 MIXED LAYER 200 WINTER 400 DEPTH (m) 600 DICOTHERMAL 800 LAYER 1000 SEASONAL MAIN THERMOCLINE THERMOCLINE 1200 ZONE (SUMMER) 1400 1600 LOW LATITUDES HIGH LATITUDES MID LATITUDES 17 CEE 370 L#26 David Reckhow Growth and Decay of Thermocline T e m p e ra tu re ( o C ) 2 4 6 8 1 0 1 2 1 4 1 6 0 J U L Y A U G M A R M A Y 2 0 S E P T 4 0 Depth (m) N O V 6 0 8 0 J A N 1 0 0 18 CEE 370 L#26 David Reckhow Lecture #26 Dave Reckhow 9
CEE 370 Lecture #26 11/8/2019 Surface Salinity of Ocean Waters 19 CEE 370 L#26 David Reckhow Salinity Distribution Precipitation and Melting of Ice 1. Salinity is lower in Polar Regions 2. Salinity is lower in Equatorial Regions 3. Salinity is lower in Estuarine Regions Evaporation and Freezing 1. Salinity is higher in mid-Latitudes 2. Salinity is higher in Med. and Red Seas 3. Salinity is higher in the Atlantic than the Pacific 20 CEE 370 L#26 David Reckhow Lecture #26 Dave Reckhow 10
CEE 370 Lecture #26 11/8/2019 Salinity vs Evaporation minus Precipitation 37 EVAPORATION - PRECIPITATION, cm/y 100 36 Salinity SALINITY 35 0 34 -100 Evap - Ppt 33 -60 -40 -20 0 20 40 60 LATITUDE 21 CEE 370 L#26 David Reckhow Salinity of Ocean Waters S a lin ity 3 3 3 5 3 7 3 3 3 5 3 4 3 6 0 0 H ig h L a t. L o w 1 0 0 0 a n d H ig h M id L o w L a t. Depth (m) a n d L a t. M id 2 0 0 0 L a t. 5 0 0 T ro p ic s 3 0 0 0 4 0 0 0 A tla n tic P a c ific 22 CEE 370 L#26 David Reckhow Lecture #26 Dave Reckhow 11
CEE 370 Lecture #26 11/8/2019 Temperature in Atlantic Ocean 23 CEE 370 L#26 David Reckhow Salinity in Atlantic Ocean Chemical Oceanography 24 CEE 370 L#26 David Reckhow Lecture #26 Dave Reckhow 12
CEE 370 Lecture #26 11/8/2019 Ocean Currents From Johnson et al., 1992 25 CEE 370 L#26 David Reckhow Depth profiles Atlantic vs Pacific 26 CEE 370 L#26 David Reckhow Lecture #26 Dave Reckhow 13
CEE 370 Lecture #26 11/8/2019 To next lecture 27 CEE 370 L#26 David Reckhow Lecture #26 Dave Reckhow 14
Recommend


More recommend
Explore More Topics
Stay informed with curated content and fresh updates.