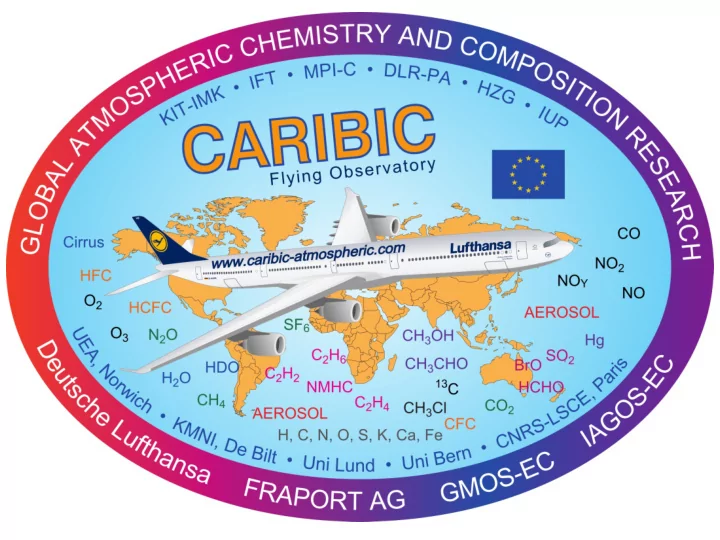

CARIBIC greenhouse gases and non-methane hydrocarbons Carl Brenninkmeijer, Tanja Schuck, and Angela Baker 10 feet wide, 1.6 ton (0.4378260 % tow)
Flight hours: 2,289 h Flight distance: 2,012,595 km CARIBIC destinations and flight trajectories
Air Sample Statistics Based on 3764 samples Pressure altitude 10,999 meter or 36,085 feet
J e t s t r e a m Mauna Loa 5 days africa ITCZ A flight from Frankfurt to Cape Town Red = low altitude Meteo calculations by Peter van Velthoven KNMI
Stratosphere Tropopause About 11 kilometer Air samples taken Troposphere Frankfurt Cape Town
Stratosphere or Troposphere or both ? CARIBIC flight 380 on 7 ‐ 8 March 2012 CARIBIC flight 386 on 25 ‐ 26 April 2012 Caracas Frankfurt Vancouver Frankfurt Applying potential vorticity from the ECMWF Meteorological analyses using ECMWF model or information from GHG analysis (N 2 O) Peter van Velthoven. KNMI, de Bilt, shows that 1138 out of 2628 samples (May 2011) the Netherlands were non ‐ tropospheric (43 %) 45 % > 1.0 PVU 55 % undisturbed free troposphere 45 % > 1.0 PVU 55 % undisturbed free troposphere 38 % > 1.5 PVU 38 % > 1.5 PVU 29 % > 3.0 PVU 29 % > 3.0 PVU 26 % stratosphere 26 % > 3.5 PVU 26 % stratosphere 26 % > 3.5 PVU Balance of 19 % tropopause layer This is for continuous data for all This is for continuous data for all Balance of 19 % tropopause layer flights flights
CARIBIC Air Sample Collection 28 @ 2.5 liter glass flasks since 2005 Additional 88 stainless steel 1 liter flasks since 2010
O above the Tropopause N 2 Using the yardstick of Andreas Zahn
The Indian Summer Monsoon Methane Plume Background: MLO (at 19 0 N) monthly averages for 2008. The gradient is derived from CARIBIC October data Schuck et al. ACP 2010
CARIBIC - ACTM comparison 1850 1850 Africa Africa CH 4 [ppb] CH 4 [ppb] 1800 1800 1850 1850 GRU/SCL GRU/SCL CH 4 [ppb] CH 4 [ppb] 1800 1800 1850 1850 BOG/CCS BOG/CCS CH 4 [ppb] CH 4 [ppb] 1800 1800 1850 1850 China China CH 4 [ppb] CH 4 [ppb] 1800 1800 1850 1850 India India CH 4 [ppb] CH 4 [ppb] 1800 1800 10 20 30 40 50 -20 0 20 40 latitude latitude Tanja Schuck and Kentaro Ishijima
Different Regions in Tropical Asia South East China Western Pacific India South China Sea
Methane Seasonality over Asia
Methane Seasonality over Asia
Monsoon ‐ related ‐ biogenic ‐ methane emissions CH 4 CH 4 CO Ethane
Calculations by Armin Rauthe ‐ Schöch using Flexpart (Andreas Stohl)
• ∆ CH 4 / ∆ CO: emissions • ~31 Tg CH 4 , ~21 Tg “extra” • ∆ CH 4 / ∆ C 2 H 6 : biogenic fraction • Up to 75% biogenic Angela Baker GRL in press
s r a e y e s e h t l l a r e v o t r o p p u s r u o y r o f u o y k n a h t , L R S E ‐ A A O N Acknowledgements go to all CARIBIC partners, please consult www.caribic ‐ atmospheric.com
Front View 2 H & 18 O DOAS SO 2 , BrO, water ‐ ozone isotopes HONO 2x computer OPC CH 4 & CO 2 NO O 2 Hg 3x CPCs, NO 2 aerosol H 2 O impactor CO NOy 3x PTRMS power power CO 2 (OVOCs)
Rear View DDB calibration 88 air samples gases (metal) NO 14 air samples NO 2 pumps (glass) 14 air NOy samples pumps (glass)
Recommend
More recommend