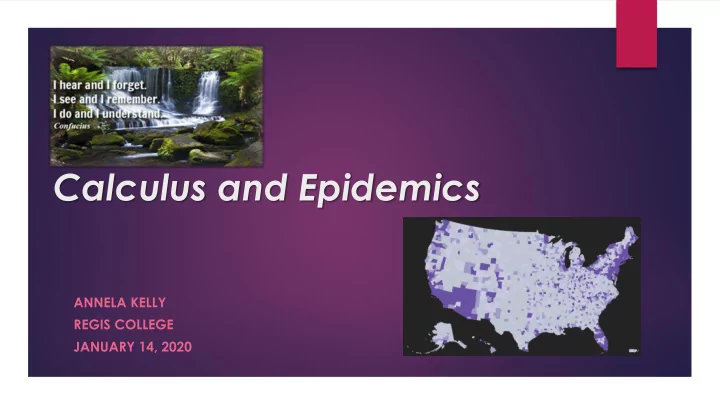

Calculus and Epidemics ANNELA KELLY REGIS COLLEGE JANUARY 14, 2020
Interdisciplinary Connections 1998 2013 (from “The Mathematical Sciences in 2025” report by The National Academy of Sciences)
Why Opioid Project? Mathematical modelling is integral part of biomedical engineering, computer game design, and many more applications Massachusetts is ranked among the top ten states with the highest rates of drug overdose deaths in 2017. Student feedback: from the project: What do you consider to be the strengths of this course? The project was interesting to also be able to use math to connect it to a real life problem. … The explanation of material and how it could relate to something learned in another math course or when the topic would be used in real life.
Project OVERVIEW The students work in group(s) to use their calculus skills from the class to analyze real world data. We will gather data from the health indicators database. We will use statistics applet to create mathematical model for each state in USA. We will use calculus to determine the trends of opioid epidemic.
Preliminary Work: Choosing an opioid related health indicator for the project. There is a lot of data available about the increase of opioid use and its consequences. For example, the health indicators database: https://opioid.amfar.org/ Different health indicators studies in class can be: The number of opioid prescriptions dispensed, per 100 U.S. residents The rate of death from drug poisoning, including both illicit and prescription drugs, per 100,000 population The total number of deaths from drug poisoning, including both illicit and prescription drugs.
Preliminary work: Data gathering DATA: The students selected 16-17 states (group of 3) and gathered data such as:
Modelling with Exponential and Polynomial Regressions We used desmos graphing calculator online to create a mathematical model for each state. The students used either polynomial or exponential correlation that best fit the model for each state: https://support.desmos.com/hc/en- us/articles/202532159-Regressions NOTE: We considered the function a good fit if the coefficient of determination r 2 was .9 or higher.
Modelling with Desmos
Modelling with Desmos
Predictions Graph all these vector-valued functions and discuss the difference from 2017 to 2019 The change in next 5(2024) and 10 (2029) years. Determine the maximums and minimums for 2019, 2024 and 2029.
Predictions
Combining all the results To collect all the work together, the students used onedrive. Our goal was to generate heat maps for the whole country for each individual year.
Heat map The class used the contour map/heat map generation such as: https://simplemaps.com/custom/us/UIgocvdU#data A more detailed one is at: https://www.espatial.com/create-heat-maps
Heat map
Heat Map for 2019
Predictions A) Originally, the highest amount of deaths due to opioids was in Pennsylvania in 2017; however the highest deaths in a state for 2019 would be in North Carolina, based on mathematical predictions. The predicted deaths in North Carolina in 2019 is 2188 deaths. This is lower than the death count for North Carolina in 2017 by 226 deaths. B) The highest death count in 2024 is 28909 deaths in Rhode Island; an increase of nearly 28000 deaths since the 2019 prediction. The problem of opioids seems to be completely solved in mostly every other state other than Rhode Island and Connecticut. C) In 2029, the highest death count due to opioids is Rhode Island once again. By this year, the prediction for the death count in Rhode Island is 184099 deaths. This is significantly higher and it appears the problem will continue to grow as time goes on. The only other state with this problem is Connecticut, having a predicted death count of 79998 deaths.
We created visual maps for the data for 2019, 2024 and 2029 and discussed the changes as class. What does the slope mean? Where is the change the most drastic the (the highest increase) and what is the estimated slope? Where is the change lowest? Why is the function value 0 in some areas in 2029 and does that mean one does not need to worry about opioid use in these states?
Analyzing our Mathematical Model Some counties near us have high rates for opioid overdose, it would be informative to study different counties is each state separately. Using statistics per state or per 10000 people will lead to different answers. Understand possible causes for the extrema. What are the challenges for future predictions? What is the end behavior of a polynomial and exponential function? What would give a better model? Higher degree, different functions etc. Presenting real- world mathematical work is a useful “employable skill” for future.
GRADING
Marketable learning outcomes Work in groups on interdisciplinary project. Collaborate with students from different backgrounds. Model data with mathematics. Build confidence in working with data and mathematics. Present and list the presentation on the resume.
Thank you! Annela Kelly annelakelly@regiscollege.edu
Recommend
More recommend