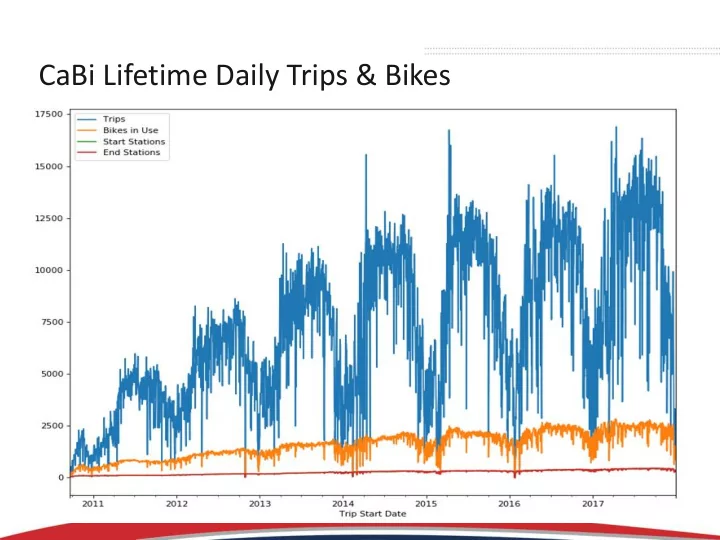

CaBi Lifetime Daily Trips & Bikes 1
Ridership is tracking with prior-year levels with over 3.2 million riders in 2017. 2
Mean Trips per Bike per Day Takeaways: CaBi peaks at about 5-6 rides per bike per day, follows similar seasonal trend to trip count ● Most dockless bike operators peaked at between 2-4 rides per bike per day ● 3
Trip and User Count Summary Trip Count User Count Bike Count Mean Trips per Bike per Day Dockless Month CaBi Dockless CaBi Dockless CaBi Dockless CaBi 2017 Sep 13,094 391,414 6,146 -- 706 3,874 3.74 5.16 2017 Oct 49,084 384,873 20,018 -- 2,436 3,772 4.18 5.09 2017 Nov 49,096 252,560 18,927 -- 2,482 3,933 3.13 3.68 2017 Dec 33,014 177,937 13,260 -- 2,751 3,987 2.46 2.83 2018 Jan 29,485 -- 9,253 -- 2,702 -- 2.22 -- 4
Dockless Trip Starts/Ends ● Points plotted at trip start location Colored by ward in which ride ● terminates Most rides start and end in same ward ● Highest concentration of trips in Wards ● 1, 2, 6 5
Distribution of Trips by Ward - Q4 2017 CaBi Trips (815,264 total) Dockless Trips (120,460 total) 6
Parking Idle Time Summary Idle time between trips helps to identify potential trouble spots (times/locations) due to parking of dockless bicycles 13% of idle events last longer than 24 hours 7
Recommend
More recommend