Bochs, Atom, Fit, Valgrind Vince Weaver October 25, 2004 Bochs - - PowerPoint PPT Presentation
Bochs, Atom, Fit, Valgrind Vince Weaver October 25, 2004 Bochs - Background bochs.sourceforge.net Emulates a full x86 powered PC Written by Kevin Lawton in 1994 Was commercial, bought in 2000 by Mandrakesoft and GPLd 1 Bochs
Bochs, Atom, Fit, Valgrind Vince Weaver October 25, 2004
Bochs - Background • bochs.sourceforge.net • Emulates a full x86 powered PC • Written by Kevin Lawton in 1994 • Was commercial, bought in 2000 by Mandrakesoft and GPL’d 1
Bochs - Features • Can emulate 386 through P4, including x86 64 • Emulates Video (VGA/VESA), Network Card, Sound Card, Hard Disk, RAM, PCI Bus, CDROM, Keyboard, Mouse, Serial Port, Parallel Port • SMP Support (non-threaded) • Experimental advanced features (PAE, 4MB Pages) 2
Bochs - Pros / Cons Pros • Emulates entire operating system (Linux, BeOS, Windows, OS/2, etc) • Emulates full hardware, including I/O, Network Load, Interrupts Cons • Must have OS running. Noise in simulation, also complicated to set up. • Not cycle accurate. Simulates in-order, so not the same memory access patterns. 3
Instrumentation Bochs can be called with instrumentation support. C++ callbacks occur when certain events happen. • Poweron / Reset / Shutdown • Branch Taken/ Not Taken / Unconditional • Opcode Decode (All relevant fields, lengths) • Interrupt / Exception • Cache / TLB Flush / Prefetch • Memory Read / Write 4
Figure 1: Bochs in action 5
Atom - Background • Instrumentation tool for { DEC / Compaq /HP } Alpha • Original paper by Srivastava and Eustace 1994 ATOM: A System for Building Customized Program Analysis Tool 6
Atom - Instrumentation • First you create an Instrumentation File, in C • The instrumentation file walks through an entire binary executable using the API provided. • You can step through at the Program, Function, Basic Block, and Instruction Level • At instrument time you can tabulate static info, and can also insert function calls to your own routines. 7
Atom - Analysis • Next you create an Analysis File, also in C • The analysis file contains all of the function calls placed into the executable at instrumentation time. • When run, these functions are called, with optional parameters you can specify (such as register contents) • Typically you open a file and write results to disk. 8
Atom - Running • When ready to run, you compile your instrumentation and analysis files. You then link them with the original executable using “atom” and create a new executable. • You run this instrumented file and it runs just like the original, only calling your function calls when appropriate. 9
Atom - Pros/Cons Pros • Instrumentation written in C (no assembly needed) • Runs at full speed of processor, no emulator slowing things down Cons • Slows down execution time of program • Alters program flow (Heisenberg) • Is Alpha / Tru64 specific. 10
Fit - Background • http://www.elis.ugent.be/fit/ • The Design and Implementation of FIT: a Flexible Instrumentation Toolkit by Bruno De Bus, Dominique Chanet, Bjorn De Sutter, Ludo Van Put, Koen De Bosschere. 2004 • ATOM compatible • Works on x86, ARM, Alpha on Linux, Tru64. IA64 and MIPS underway. • Available under GPL. 11
Fit vs Atom • Three ways to instrument: dynamic (hard, no basic block knowledge), simulation (special case of dynamic) and static (FIT, Atom) • The claim is ATOM interferes by having to have un-instrumented C routines which interfere (ie, extra file handles in linked list). Basic block numbers disturbed by extra instrumentation blocks (address offset changes). Also depends on empty address space between code and data segment, where atom puts variables/functions (not portable). 12
Fit vs Atom 2 • FIT has instrumentation file like ATOM. • FIT has own support library, instead of reusing C-library, to limit crossover interference. • splits heap in two so that mallocs in analysis code not interfere with main program. • Keeps lookup table and reverse-translates addresses back to match original executable. • Need a kernel patch(!) to handle syscalls if want to use reverse-translation 13
FIT - Theoretical Pros/Cons Pros • Cross-platform • Can be more precise than ATOM. Cons • Slows down execution time of program • Won’t work with self-modifying code • Requires modified compiler toolchain. • Requires all object files (not just the executable) and must be statically linked. 14
FIT - Actual Usage Report • Cannot output results! After much trying still cannot get analysis data from fit. File I/O and printing to the screen seem to be disabled with fit 0.1?! • Instrumenting is a complicated 3-step process involving a huge (120MB) extra toolchain, and lots of weird cc options. • Needs at least 512MB of memory to instrument. Tried on a 128MB machine and a simple instrumentation was still going after 20 hours. On a 1GB machine the same run took 2 minutes to instrument. • Not as atom-compatible as one could hope for. Lots of common things aren’t implemented yet. • Will only compile with gcc 3.4, which is extremely new. 15
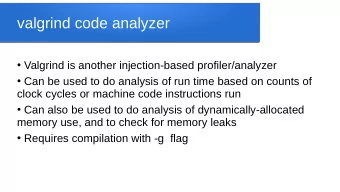
Valgrind • http://valgrind.kde.org/ • Short i in grind. Norse mythology. Door gaurding entrance to Valhalla • Started as a memory profiler, to catch malloc() / free() errors. • Valgrind works by actually taking each basic block, converting it to RISC code (on-the-fly), instrumenting, then re-converting back to new x86 code which is finally executed. These new basic blocks are cached (For speed) • Primary platform is x86, with x86 64, PowerPC and others underway 16
cachegrind • http://kcachegrind.sourceforge.net/ • Uses valgrind framework, but uses the infrastructure to do cache / program analysis. • By default it simulates the cache architecture of the local machine, but different sizes can be chosen at the commandline. • Can easily be modified to dump the addresses of L2 cache misses. Should also be possible to get timestamp info, but will take a bite more effort. • Up to 50x slowdown. 17
Figure 2: Sample cachegrind run 18
Figure 3: Kcachegrind GUI for valgrind output 19
Recommend
More recommend
Explore More Topics
Stay informed with curated content and fresh updates.
