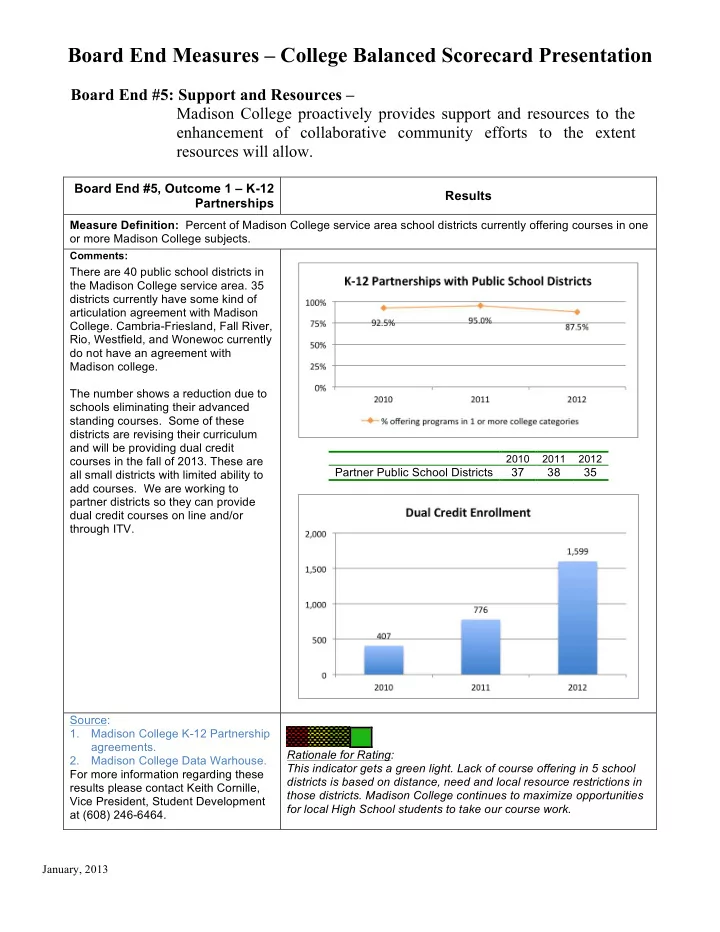

Board End Measures – College Balanced Scorecard Presentation Board End #5: Support and Resources – Madison College proactively provides support and resources to the enhancement of collaborative community efforts to the extent resources will allow. Board End #5, Outcome 1 – K-12 Results Partnerships Measure Definition: Percent of Madison College service area school districts currently offering courses in one or more Madison College subjects. Comments: There are 40 public school districts in the Madison College service area. 35 districts currently have some kind of articulation agreement with Madison College. Cambria-Friesland, Fall River, Rio, Westfield, and Wonewoc currently do not have an agreement with Madison college. The number shows a reduction due to schools eliminating their advanced standing courses. Some of these districts are revising their curriculum and will be providing dual credit 2010 2011 2012 courses in the fall of 2013. These are Partner Public School Districts 37 38 35 all small districts with limited ability to add courses. We are working to partner districts so they can provide dual credit courses on line and/or through ITV. Source: 1. Madison College K-12 Partnership agreements. Rationale for Rating: 2. Madison College Data Warhouse. This indicator gets a green light. Lack of course offering in 5 school For more information regarding these districts is based on distance, need and local resource restrictions in results please contact Keith Cornille, those districts. Madison College continues to maximize opportunities Vice President, Student Development for local High School students to take our course work. at (608) 246-6464. January, 2013
Board End Measures – College Balanced Scorecard Presentation Board End #5, Outcome 2 – Results Postsecondary Partnerships Measure Definition: Number of transfers from Madison College to 4 year colleges each year and number of postsecondary institutions with articulation agreements allowing Madison College graduates to participate in a Bachelors degree completion option. Comments: The chart to the right shows transfers from Madison College from 2008-2012. These were obtained by searching the National Student Clearinghouse, a database that tracks enrollment at colleges across the nation. Transfers have increased steadily between 2008 and 2012. 2012 transfers were 418 students (13.3%) above those in 2011. We currently have 128 program-to- program articulation agreements with 28 four-year colleges and universities. These agreements enable students to transfer the credits earned in a technical program and complete a bachelor’s degree. 2008 2009 2010 2011 2012 % Inc from Prior Year 6.6% 11.0% 21.3% 11.3% 13.3% Madison College students may transfer to hundreds of other four-year colleges using specific course-to-course and other articulation agreements. Madison College remains the largest transfer institution to the UW System and to the UW Madison. • 331 new UW Madison students transferred credits from Madison College in 2010-11. • 733 new UW System students transferred credits from Madison College in 2011. • Madison College also sends transfer students to UW who enter without transferring credits. Sources: 1. Madison College query of National Student Clearinghouse Data. 2. Madison College articulation agreements. 3. UW System Memo: Undergraduate Transfer Students: 2010-11 Rationale for Rating: For more information regarding these The increasing number of students and opportunities for Bachelors results please contact Keith Cornille, degree completion warrants a green light for this indicator. Vice President, Student Development at (608) 246-6464. January, 2013
Board End Measures – College Balanced Scorecard Presentation Board End #5, Outcome 3 – Results Public Perception Measure Definition: Overall Score given by a random selection of district residents on an eight question survey. Comments: Madison College contracted with NBS Solutions to do the DaneTrak Survey again in 2012 after not doing the survey in 2011. DaneTrak is a phone survey of district residents. This survey involves phone interviews with 400 district residents in Dane County and 200 residents outside of Dane County. Each respondent is asked to grade the college in 8 categories. Overall ratings are shown to the right. This is shown as an overall grade point average on the chart to the right. The 2012 DaneTrak overall ratings showed significant improvement over 2010. The Madison College Referendum was passed during this time. The higher rating likely reflects a vote of confidence for the direction taken by the college. Data Note: The scale for the 2012 survey was changed from an A-F grade scale to a 5-point Lickert rating scale. Previous year ratings were adjusted for comparability. Madison College Community Contribution Survey Madison College Community Contribution Survey Number of Organizations 1 2 3 Responses 191 98 38 An internal Madison College Employee Percent 47% 24% 9% Community contribution survey was done in 2012 to assess employee contribution in professional and community organizations. 409 Madison College employees were surveyed concerning their participation in non-profit organizations. • 191 employees (47%) participated in at least one community organization. • 170 employees (42%) held leadership positions. Categories are listed at the right. • Madison College Employees play a significant role in a diverse array of community and professional non-profit organizations. January, 2013
Board End Measures – College Balanced Scorecard Presentation Source: 1. DaneTrak survey report, NBS Solutions. 2. Madison College Employee Rationale for Rating: Community Participation Survey This indicator gets a green light as perceptions are generally positive, as shown by consistently high marks with this indicator as well as For more information regarding these high degree of participation in non-profit community and professional results please contact Diane Walleser, organizations. Vice President for Enrollment Management at (608) 246-6550. January, 2013
Recommend
More recommend