Black Carbon Measurements at the Cape Grim Baseline Air Pollution - PowerPoint PPT Presentation
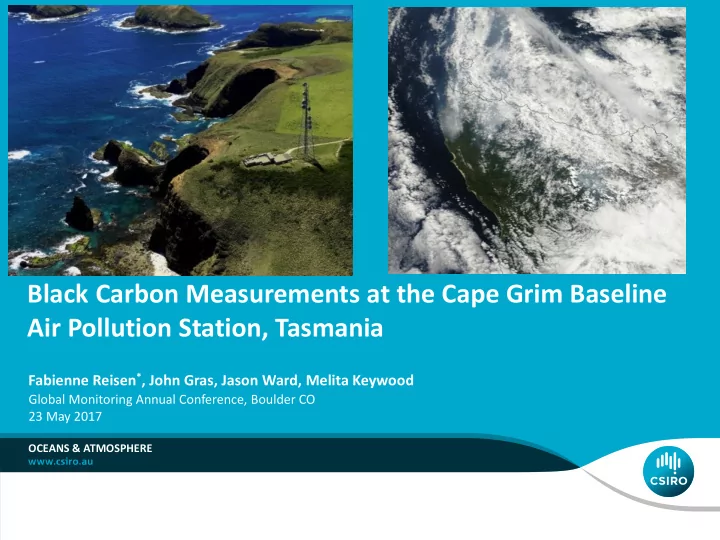
Black Carbon Measurements at the Cape Grim Baseline Air Pollution Station, Tasmania Fabienne Reisen * , John Gras, Jason Ward, Melita Keywood Global Monitoring Annual Conference, Boulder CO 23 May 2017 OCEANS & ATMOSPHERE Cape Grim Baseline
Black Carbon Measurements at the Cape Grim Baseline Air Pollution Station, Tasmania Fabienne Reisen * , John Gras, Jason Ward, Melita Keywood Global Monitoring Annual Conference, Boulder CO 23 May 2017 OCEANS & ATMOSPHERE
Cape Grim Baseline Air Pollution Station Black carbon measurements 10m mast via 18 RH controlled heater mm diameter (RH < 40%) outlet BGI 1 μ m VSCC Year Instrument 1990-2007 Aethalometer- Magee Scientific AE10 2007 Thermo MAAP 5012 (670nm) Sep 2015 Photoacoustic Extinctiometer DMT PAX – 870nm June 2016 Tricolor Absorption Photometer (TAP-NOAA/Brechtel) 2 | Black carbon measurements at Cape Grim| Fabienne Reisen
Initial climatology of BC (1990-1997) • Main contributors to BC : Northern TAS and Melbourne/eastern VIC (peak BC autumn/winter) Baseline conditions : • peak BC in spring attributed to long-range transport of smoke • Baseline sector : potentially wind-related artefacts due to scattering or re-suspended soil 3 | Black carbon measurements at Cape Grim| Fabienne Reisen
Origins of air masses at Cape Grim Continental Australian sector Tasmanian sector Baseline sector 4 | Black carbon measurements at Cape Grim| Fabienne Reisen
What are the sources of BC at Cape Grim? Long-range transport of continental smoke sector Tasmanian sector 5 | Black carbon measurements at Cape Grim| Fabienne Reisen
Black carbon concentrations 2011-2017 Baseline Air 6 | Black carbon measurements at Cape Grim | Fabienne Reisen
Daily median BC – highlighting few large events Jan/Feb 2016 3000 eBC (ng m -3 ) 2000 7 April 1000 20-21 May 7 April 22 March 0 2011 2012 2013 2014 2015 2016 2017 7 | Black carbon measurements at Cape Grim | Fabienne Reisen
Tasmanian Fires 2016 At least 70 separate fires that spread quickly burning an area of ~ 100,000 ha over a 6-week period. This was one of the largest and most ecologically damaging fires to occur in Tasmania in recent history. 8 | Black carbon measurements at Cape Grim | Fabienne Reisen
Tasmanian Fires 2016 25 Jan 2016 EF BC =0.3 g/kg fuel 12 Feb 2016 9 | Black carbon measurements at Cape Grim | Fabienne Reisen
Potential sources of high BC 10 | Black carbon measurements at Cape Grim | Fabienne Reisen
High BC pollution events from continental sector 11 | Black carbon measurements at Cape Grim | Fabienne Reisen
High BC pollution events from continental sector A D A B C B C D 12 | Black carbon measurements at Cape Grim | Fabienne Reisen
High BC levels from Tasmanian sector April 2016 13 | Black carbon measurements at Cape Grim | Fabienne Reisen
Seasonal cycles for baseline sector 14 | Black carbon measurements at Cape Grim | Fabienne Reisen
Seasonal cycles for baseline sector Additional criteria for baseline conditions: Radon < 100 mBq m -3 15 | Black carbon measurements at Cape Grim | Fabienne Reisen
Seasonal BC concentrations • Autumn peak for continental sector – increased biomass burning from prescribed burns & woodheaters • Winter peak for Tasmanian sector – domestic woodsmoke • Slight spring peak for baseline sector 16 | Black carbon measurements at Cape Grim | Fabienne Reisen
Future work • Extend analysis of BC measurements to years prior 2011 • Investigate long-term trend in BC concentrations at Cape Grim • Evaluate the TAP and PAX 14 12 TAP Absorption coefficient Y = 5.26 * X + 0.058 10 r 2 = 0.976 8 Y = 4.05 * X + 0.071 r 2 = 0.987 6 Y = 2.60 * X + 0.081 (r 2 = 0.994) 4 2 0 0 0.4 0.8 1.2 1.6 2 MAAP eBC (µg m -3 ) 17 | Black carbon measurements at Cape Grim | Fabienne Reisen
Thank you Oceans and Atmosphere Fabienne Reisen Senior Research Scientist t +61 3 9239 4435 e fabienne.reisen@csiro.au OCEANS AND ATMOSPHERE
Recommend


More recommend
Explore More Topics
Stay informed with curated content and fresh updates.