BBM 413 Image filtering: computes a function of a local neighborhood - - PowerPoint PPT Presentation

bbm 413
SMART_READER_LITE
LIVE PREVIEW

BBM 413 Image filtering: computes a function of a local neighborhood - - PowerPoint PPT Presentation

Image Filtering BBM 413 Image filtering: computes a function of a local neighborhood at Fundamentals of each pixel position Image Processing Called Local operator, Neighborhood operator, or Window operator f :


slide-1
SLIDE 1

BBM 413 Fundamentals of Image Processing

Erkut Erdem

  • Dept. of Computer Engineering

Hacettepe University

Spatial Filtering

Image Filtering

  • Image filtering: computes a function of a local neighborhood at

each pixel position

  • Called “Local operator,” “Neighborhood operator,” or

“Window operator”

  • f: image è image
  • Uses:

– Enhance images

  • Noise reduction, smooth, resize, increase contrast,

recolor, artistic effects, etc. – Extract features from images

  • Texture, edges, distinctive points, etc.

– Detect patterns

  • Template matching, e.g., eye template

Slide credit: D. Hoiem

Filtering

  • The name “filter” is borrowed from frequency domain

processing (next week’s topic)

  • Accept or reject certain frequency components
  • Fourier (1807):

Periodic functions could be represented as a weighted sum of sines and cosines

Image courtesy of Technology Review
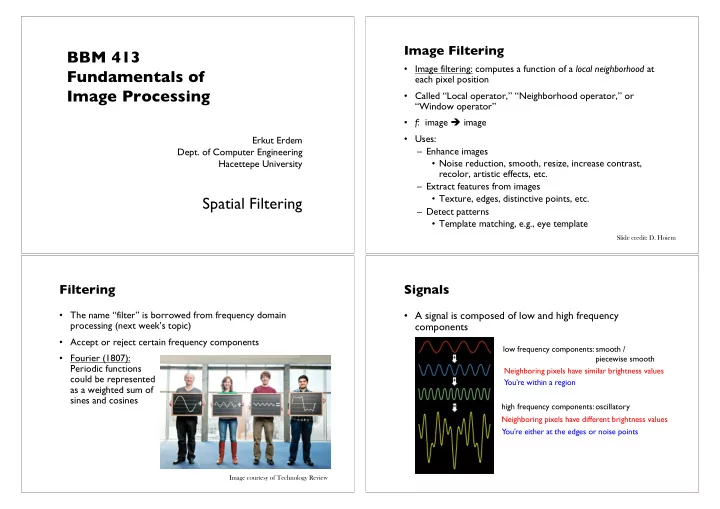
Signals

  • A signal is composed of low and high frequency

components

low frequency components: smooth / piecewise smooth high frequency components: oscillatory Neighboring pixels have similar brightness values Neighboring pixels have different brightness values You’re within a region You’re either at the edges or noise points

slide-2
SLIDE 2

Low/high frequencies vs. fine/coarse-scale details

  • L. Karacan, E. Erdem and A. Erdem, Structure Preserving Image Smoothing via Region Covariances, TOG, 2013

Original image Low-frequencies (coarse-scale details) boosted High-frequencies (fine-scale details) boosted

Signals – Examples Motivation: noise reduction

  • Assume image is degraded with an additive model.
  • Then,

Observation = True signal + noise Observed image = Actual image + noise

low-pass filters high-pass filters smooth the image

Common types of noise

– Salt and pepper noise: random occurrences of black and white pixels – Impulse noise: random occurrences of white pixels – Gaussian noise: variations in intensity drawn from a Gaussian normal distribution

Slide credit: S. Seitz

slide-3
SLIDE 3

Gaussian noise

Slide credit: M. Hebert

>> noise = randn(size(im)).*sigma; >> output = im + noise;

What is the impact of the sigma?

Motivation: noise reduction

  • Make multiple observations of the same static scene
  • Take the average
  • Even multiple images of the same static scene will not be

identical.

Adapted from: K. Grauman

Motivation: noise reduction

  • Make multiple observations of the same static scene
  • Take the average
  • Even multiple images of the same static scene will not be

identical.

  • What if we can’t make multiple observations?

What if there’s only one image?

Adapted from: K. Grauman

Image Filtering

  • Idea: Use the information coming from the neighboring

pixels for processing

  • Design a transformation function of the local

neighborhood at each pixel in the image

– Function specified by a “filter” or mask saying how to combine values from neighbors.

  • Various uses of filtering:

– Enhance an image (denoise, resize, etc) – Extract information (texture, edges, etc) – Detect patterns (template matching)

Adapted from: K. Grauman

slide-4
SLIDE 4

Filtering

  • Processing done on a function

– can be executed in continuous form (e.g. analog circuit) – but can also be executed using sampled representation

  • Simple example: smoothing by averaging

Slide credit: S. Marschner

Linear filtering

  • Filtered value is the linear combination of neighboring pixel

values.

  • Key properties

– linearity: filter(f + g) = filter(f) + filter(g) – shift invariance: behavior invariant to shifting the input

  • delaying an audio signal
  • sliding an image around
  • Can be modeled mathematically by convolution

Adapted from: S. Marschner

First attempt at a solution

  • Let’s replace each pixel with an average of all the values in its

neighborhood

  • Assumptions:

– Expect pixels to be like their neighbors (spatial regularity in images) – Expect noise processes to be independent from pixel to pixel

Slide credit: S. Marschner, K. Grauman

First attempt at a solution

  • Let’s replace each pixel with an average of all the values in its

neighborhood

  • Moving average in 1D:

Slide credit: S. Marschner

slide-5
SLIDE 5

Convolution warm-up

  • Same moving average operation, expressed mathematically:

Slide credit: S. Marschner

Discrete convolution

  • Simple averaging:

– every sample gets the same weight

  • Convolution: same idea but with weighted average

– each sample gets its own weight (normally zero far away)

  • This is all convolution is: it is a moving weighted average

Slide credit: S. Marschner

Filters

  • Sequence of weights a[j] is called a filter
  • Filter is nonzero over its region of support

– usually centered on zero: support radius r

  • Filter is normalized so that it sums to 1.0

– this makes for a weighted average, not just any

  • ld weighted sum
  • Most filters are symmetric about 0

– since for images we usually want to treat left and right the same

a box filter

Slide credit: S. Marschner

Convolution and filtering

  • Can express sliding average as convolution with a box filter
  • abox = […, 0, 1, 1, 1, 1, 1, 0, …]

Slide credit: S. Marschner

slide-6
SLIDE 6

Example: box and step

Slide credit: S. Marschner

Convolution and filtering

  • Convolution applies with any sequence of weights
  • Example: bell curve (gaussian-like) […, 1, 4, 6, 4, 1, …]/16

Slide credit: S. Marschner

And in pseudocode…

Slide credit: S. Marschner

Key properties

  • Linearity: filter(f1 + f2) = filter(f1) + filter(f2)
  • Shift invariance: filter(shift(f)) = shift(filter(f))
  • same behavior regardless of pixel location, i.e. the value of the output

depends on the pattern in the image neighborhood, not the position of the neighborhood.

  • Theoretical result: any linear shift-invariant operator can be

represented as a convolution

Slide credit: S. Lazebnik

slide-7
SLIDE 7

Properties in more detail

  • Commutative: a * b = b * a

– Conceptually no difference between filter and signal

  • Associative: a * (b * c) = (a * b) * c

– Often apply several filters one after another: (((a * b1) * b2) * b3) – This is equivalent to applying one filter: a * (b1 * b2 * b3)

  • Distributes over addition: a * (b + c) = (a * b) + (a * c)
  • Scalars factor out: ka * b = a * kb = k (a * b)
  • Identity: unit impulse e = […, 0, 0, 1, 0, 0, …],

a * e = a

Slide credit: S. Lazebnik

A gallery of filters

  • Box filter

– Simple and cheap

  • Tent filter

– Linear interpolation

  • Gaussian filter

– Very smooth antialiasing filter

Slide credit: S. Marschner

Box filter

Slide credit: S. Marschner

Tent filter

Slide credit: S. Marschner

slide-8
SLIDE 8

Gaussian filter

Slide credit: S. Marschner

Discrete filtering in 2D

  • Same equation, one more index

– now the filter is a rectangle you slide around over a grid of numbers

  • Usefulness of associativity

– often apply several filters one after another: (((a * b1) * b2) * b3) – this is equivalent to applying one filter: a * (b1 * b2 * b3)

Slide credit: S. Marschner

And in pseudocode…

Slide credit: S. Marschner

Moving Average In 2D

90 90 90 90 90 90 90 90 90 90 90 90 90 90 90 90 90 90 90 90 90 90 90 90 90 90 90 90 90 90 90 90 90 90 90 90 90 90 90 90 90 90 90 90 90 90 90 90 90 90

Slide credit: S. Seitz

slide-9
SLIDE 9

Moving Average In 2D

90 90 90 90 90 90 90 90 90 90 90 90 90 90 90 90 90 90 90 90 90 90 90 90 90 10 90 90 90 90 90 90 90 90 90 90 90 90 90 90 90 90 90 90 90 90 90 90 90 90 90

Slide credit: S. Seitz

Moving Average In 2D

90 90 90 90 90 90 90 90 90 90 90 90 90 90 90 90 90 90 90 90 90 90 90 90 90 10 20 90 90 90 90 90 90 90 90 90 90 90 90 90 90 90 90 90 90 90 90 90 90 90 90 90

Slide credit: S. Seitz

Moving Average In 2D

90 90 90 90 90 90 90 90 90 90 90 90 90 90 90 90 90 90 90 90 90 90 90 90 90 10 20 30 90 90 90 90 90 90 90 90 90 90 90 90 90 90 90 90 90 90 90 90 90 90 90 90 90

Slide credit: S. Seitz

Moving Average In 2D

10 20 30 30 90 90 90 90 90 90 90 90 90 90 90 90 90 90 90 90 90 90 90 90 90 90 90 90 90

Slide credit: S. Seitz

slide-10
SLIDE 10

Moving Average In 2D

90 90 90 90 90 90 90 90 90 90 90 90 90 90 90 90 90 90 90 90 90 90 90 90 90 10 20 30 30 30 20 10 20 40 60 60 60 40 20 30 60 90 90 90 60 30 30 50 80 80 90 60 30 30 50 80 80 90 60 30 20 30 50 50 60 40 20 10 20 30 30 30 30 20 10 10 10 10

Slide credit: S. Seitz

Image Correlation Filtering

  • Center filter g at each pixel in image f
  • Multiply weights by corresponding pixels
  • Set resulting value in output image h
  • g is called a filter, mask, kernel, or template
  • Linear filtering is sum of dot product at each pixel position
  • Filtering operation called cross-correlation

Slide credit: C. Dyer

Correlation filtering

Say the averaging window size is 2k+1 x 2k+1: Loop over all pixels in neighborhood around image pixel F[i,j] Attribute uniform weight to each pixel Now generalize to allow different weights depending on neighboring pixel’s relative position: Non-uniform weights

Slide credit: K. Grauman

Correlation filtering

Filtering an image: replace each pixel with a linear combination of its neighbors. The filter “kernel” or “mask” H[u,v] is the prescription for the weights in the linear combination. This is called cross-correlation, denoted

Slide credit: K. Grauman

slide-11
SLIDE 11

Correlation filtering Correlation filtering Cross correlation example

  • Crosscorrelation– example

Left Right scanline

Norm.corr

Slide credit: Fei-Fei Li

Averaging filter

  • What values belong in the kernel H for the moving

average example?

10 20 30 30 90 90 90 90 90 90 90 90 90 90 90 90 90 90 90 90 90 90 90 90 90 90 90 90 90

1 1 1 1 1 1 1 1 1 “box filter”

?

Slide credit: K. Grauman

slide-12
SLIDE 12

Smoothing by averaging

depicts box filter: white = high value, black = low value

  • riginal

filtered

What if the filter size was 5 x 5 instead of 3 x 3?

Slide credit: K. Grauman

Boundary issues

  • What is the size of the output?
  • MATLAB: output size / “shape” options

– shape = ‘full’: output size is sum of sizes of f and g – shape = ‘same’: output size is same as f – shape = ‘valid’: output size is difference of sizes of f and g

f g g g g f g g g g f g g g g full same valid

Slide credit: S. Lazebnik

Boundary issues

  • What about near the edge?

– the filter window falls off the edge of the image – need to extrapolate – methods:

  • clip filter (black)
  • wrap around
  • copy edge
  • reflect across edge

Slide credit: S. Marschner

Boundary issues

  • What about near the edge?

– the filter window falls off the edge of the image – need to extrapolate – methods (MATLAB):

  • clip filter (black):

imfilter(f, g, 0)

  • wrap around:

imfilter(f, g, ‘circular’)

  • copy edge:

imfilter(f, g, ‘replicate’)

  • reflect across edge:

imfilter(f, g, ‘symmetric’)

Slide credit: S. Marschner

slide-13
SLIDE 13

Gaussian filter

90 90 90 90 90 90 90 90 90 90 90 90 90 90 90 90 90 90 90 90 90 90 90 90 90 1 2 1 2 4 2 1 2 1

  • What if we want nearest neighboring pixels to have the

most influence on the output?

  • Removes high-frequency components from the image

(“low-pass filter”). This kernel is an approximation of a 2d Gaussian function:

Slide credit: S. Seitz

Smoothing with a Gaussian

Slide credit: K. Grauman

Gaussian filters

  • What parameters matter here?
  • Size of kernel or mask

– Note, Gaussian function has infinite support, but discrete filters use finite kernels

σ = 5 with 10 x 10 kernel σ = 5 with 30 x 30 kernel

Slide credit: K. Grauman

Gaussian filters

  • What parameters matter here?
  • Variance of Gaussian: determines extent of

smoothing

σ = 2 with 30 x 30 kernel σ = 5 with 30 x 30 kernel

Slide credit: K. Grauman

slide-14
SLIDE 14

Choosing kernel width

  • Rule of thumb: set filter half-width to about 3σ

Slide credit: S. Lazebnik

Matlab

>> hsize = 10; >> sigma = 5; >> h = fspecial(‘gaussian’ hsize, sigma); >> mesh(h); >> imagesc(h); >> outim = imfilter(im, h); % correlation >> imshow(outim);

  • utim

Slide credit: K. Grauman

Smoothing with a Gaussian

for sigma=1:3:10 h = fspecial('gaussian‘, fsize, sigma);

  • ut = imfilter(im, h);

imshow(out); pause; end

Parameter σ is the “scale” / “width” / “spread” of the Gaussian kernel, and controls the amount of smoothing.

Slide credit: K. Grauman

Gaussian Filters

= 30 pixels = 1 pixel = 5 pixels = 10 pixels

Slide credit: C. Dyer

slide-15
SLIDE 15

Spatial Resolution and Color

R G B

  • riginal

Slide credit: C. Dyer

Blurring the G Component

R G B

  • riginal

processed

Slide credit: C. Dyer

Blurring the R Component

  • riginal

processed R G B

Slide credit: C. Dyer

Blurring the B Component

  • riginal

R G B processed

Slide credit: C. Dyer

slide-16
SLIDE 16

L a b A transformation

  • f the colors into

a color space that is more perceptually meaningful: L: luminance, a: red-green, b: blue-yellow

“Lab” Color Representation

Slide credit: C. Dyer

L a b

  • riginal

processed

Blurring L

Slide credit: C. Dyer

  • riginal

L a b processed

Blurring a

Slide credit: C. Dyer

  • riginal

L a b processed

Blurring b

Slide credit: C. Dyer

slide-17
SLIDE 17

Separability

  • In some cases, filter is separable, and we can factor into two

steps: – Convolve all rows – Convolve all columns

Slide credit: K. Grauman Slide credit: D. Lowe

Separability of the Gaussian filter Separability example

* *

= = 2D convolution (center location only) The filter factors into a product of 1D filters: Perform convolution along rows: Followed by convolution along the remaining column:

Slide credit: K. Grauman

Why is separability useful?

  • What is the complexity of filtering an n×n image with an m×m

kernel?

– O(n2 m2)

  • What if the kernel is separable?

– O(n2 m)

Slide credit: S. Lazebnik

slide-18
SLIDE 18

Properties of smoothing filters

  • Smoothing

– Values positive – Sum to 1 à constant regions same as input – Amount of smoothing proportional to mask size – Remove “high-frequency” components; “low-pass” filter

Slide credit: K. Grauman

Filtering an impulse signal

1 a b c d e f g h i

What is the result of filtering the impulse signal (image) F with the arbitrary kernel H?

?

Slide credit: K. Grauman

Convolution

  • Convolution:

– Flip the filter in both dimensions (bottom to top, right to left) – Then apply cross-correlation

Notation for convolution

  • perator

F H

Slide credit: K. Grauman

Convolution vs. Correlation

  • A convolution is an integral that expresses the amount of
  • verlap of one function as it is shifted over another function.

– convolution is a filtering operation

  • Correlation compares the similarity of two sets of data.

Correlation computes a measure of similarity of two input signals as they are shifted by one another. The correlation result reaches a maximum at the time when the two signals match best . – correlation is a measure of relatedness of two signals

Slide credit: Fei-Fei Li

slide-19
SLIDE 19

Convolution vs. correlation

Convolution Cross-correlation For a Gaussian or box filter, how will the outputs differ? If the input is an impulse signal, how will the outputs differ?

Slide credit: K. Grauman

Predict the outputs using correlation filtering

1

* = ?

1

* = ?

1 1 1 1 1 1 1 1 1 2

  • *

= ?

Slide credit: K. Grauman

Practice with linear filters

1 Original

?

Slide credit: D. Lowe

Practice with linear filters

1 Original Filtered (no change)

Slide credit: D. Lowe

slide-20
SLIDE 20

Practice with linear filters

1 Original

?

Slide credit: D. Lowe

Practice with linear filters

1 Original Shifted left by 1 pixel with correlation

Slide credit: D. Lowe

Practice with linear filters

Original

?

1 1 1 1 1 1 1 1 1

Slide credit: D. Lowe

Practice with linear filters

Original 1 1 1 1 1 1 1 1 1 Blur (with a box filter)

Slide credit: D. Lowe

slide-21
SLIDE 21

Practice with linear filters

Original 1 1 1 1 1 1 1 1 1 2

  • ?

Slide credit: D. Lowe

Practice with linear filters

Original 1 1 1 1 1 1 1 1 1 2

  • Sharpening filter:

accentuates differences with local average

Slide credit: D. Lowe

Filtering examples: sharpening

Slide credit: K. Grauman

Sharpening

  • What does blurring take away?
  • riginal

smoothed (5x5)

detail

=

sharpened

= Let’s add it back:

  • riginal

detail

+

Slide credit: S. Lazebnik

slide-22
SLIDE 22

Unsharp mask filter

Gaussian unit impulse Laplacian of Gaussian

) ) 1 (( ) 1 ( ) ( g e f g f f g f f f

  • +

* = *

  • +

= *

  • +

a a a a

image blurred image unit impulse (identity)

Slide credit: S. Lazebnik

Sharpening using Unsharp Mask Filter

Original Filtered result

Slide credit: C. Dyer

Unsharp Masking

Slide credit: C. Dyer

Other filters

  • 1

1

  • 2

2

  • 1

1 Vertical Edge (absolute value)

Sobel

Slide credit: J. Hays

slide-23
SLIDE 23

Other filters

  • 1
  • 2
  • 1

1 2 1 Horizontal Edge (absolute value)

Sobel

Slide credit: J. Hays

Median filters

  • A Median Filter operates over a window by selecting the

median intensity in the window.

  • What advantage does a median filter have over a mean filter?
  • Is a median filter a kind of convolution?

adapted from: S. Seitz

Median filter

  • No new pixel values

introduced

  • Removes spikes: good for

impulse, salt & pepper noise

  • Non-linear filter

Slide credit: K. Grauman

Median filter

Salt and pepper noise Median filtered

Slide credit: M. Hebert

Plots of a row of the image Matlab: output im = medfilt2(im, [h w]);

slide-24
SLIDE 24

Median filter

  • What advantage does median filtering have over Gaussian

filtering?

– Robustness to outliers – Median filter is edge preserving

Slide credit: K. Grauman

Nextweek

  • Introduction to frequency domain techniques
  • The Fourier Transform