Backup Q2 2005. Deutsche Telekom Investor Relations, Bonn office - PowerPoint PPT Presentation
Backup Q2 2005. Deutsche Telekom Investor Relations, Bonn office Phone +49 228 181 - 8 88 80 Fax +49 228 181 - 8 88 99 E-Mail investor.relations@telekom.de Investor Relations, New York office Phone +1 212 424 2926 Phone + 1 877
Backup Q2 2005. Deutsche Telekom Investor Relations, Bonn office Phone +49 228 181 - 8 88 80 Fax +49 228 181 - 8 88 99 E-Mail investor.relations@telekom.de Investor Relations, New York office Phone +1 212 424 2926 Phone + 1 877 DT SHARE (toll-free) Fax +1 212 424 2986 E-Mail investor.relations@usa.telekom.de Check out our IR-website under www.telekom.de/investor-relations for: � this backup in .pdf- and excel-format � the IR calendar 2005 � detailed information for debt investors � shareholder structure � Corporate Governance
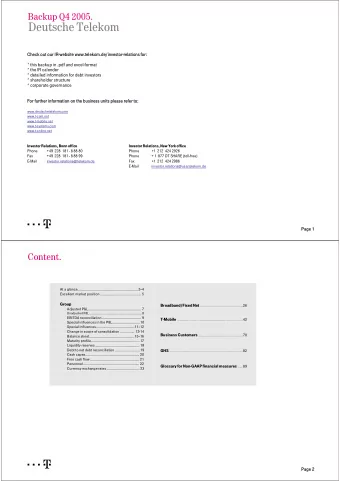
Content. At a glance...............................................................3--4 Excellent market position........................................... 5 Group Broadband/Fixed Net .......................................... 26 Adjusted P&L....................................................... 7 Unadjusted P&L...............................................................8 EBITDA reconciliation......................................... 9 T-Mobile ................................................................ 42 Special influences in the P&L............................ 10 Special influences........................................11--12 Change in scope of consolidation ............... 13-14 Business Customers ............................................ 78 Balance sheet...............................................15--17 Maturity profile.................................................. 18 Debt to net debt reconciliation ......................... 19 Cash capex........................................................ 20 GHS ....................................................................... 90 Free cash flow ................................................... 21 Personnel.......................................................... 22 Currency exchange rates.................................. 23 Glossary for Non-GAAP financial measures ..... 96
At a Glance I. € million Q2/04 Q3/04 Q4/04 FY/04 Q1/05 Q2 /05 % Q2/04 H1/04 H1/05 %H1/04 Total Revenue Broadband/Fixedline 6,489 -4.7% 13,750 13,127 -4.5% 6,809 6,609 6,651 27,010 6,638 T-Com 6,119 -5.4% 13,069 12,423 -4.9% 6,470 6,254 6,278 25,601 6,304 T-Online 499 486 538 2,012 509 522 4.6% 988 1,031 4.4% T-Mobile 6,649 6,914 6,692 26,527 6,746 7,197 8.2% 12,921 13,943 7.9% Business Customers 3,272 3,169 3,441 12,957 3,124 3,206 -2.0% 6,347 6,330 -0.3% GHS 882 887 891 3,526 853 883 0.1% 1,748 1,736 -0.7% Reconciliation -3,235 -3,226 -2,935 -12,660 -2,985 -3,027 6.4% -6,499 -6,012 7.5% Net Revenue Broadband/Fixedline 5,609 5,433 5,714 22,409 5,527 5,439 -3.0% 11,262 10,966 -2.6% T-Mobile 6,372 6,663 6,449 25,450 6,531 6,962 9.3% 12,338 13,493 9.4% Business Customers 2,327 2,200 2,505 9,241 2,253 2,281 -2.0% 4,536 4,534 0.0% GHS 69 57 72 260 65 66 -4.3% 131 131 0.0% Group 14,377 14,353 14,740 57,360 14,376 14,748 2.6% 28,267 29,124 3.0% EBITDA excluding special influences Broadband/Fixedline 2,577 2,495 2,509 10,173 2,517 2,440 -5.3% 5,169 4,957 -4.1% T-Com 2,439 2,358 2,435 9,722 2,436 2,375 -2.6% 4,929 4,811 -2.4% T-Online 129 136 81 464 88 84 -34.9% 247 172 -30.4% T-Mobile 2,127 2,374 2,068 8,395 2,111 2,481 16.6% 3,953 4,592 16.2% Business Customers 426 453 365 1,638 396 410 -3.8% 820 806 -1.7% GHS -165 -22 -274 -548 -72 -66 60.0% -252 -138 45.2% Reconciliation -42 -7 58 -41 -34 -40 4.8% -92 -74 19.6% Group 4,923 5,293 4,726 19,617 4,918 5,225 6.1% 9,598 10,143 5.7% Page 3 Unaudited and preliminary Figures
At a Glance II. € million Q2/04 Q3/04 Q4/04 FY/04 Q1/05 Q2 /05 % Q2/04 H1/04 H1/05 %H1/04 EBITDA Margin excluding special influences Broadband/Fixedline 37.6% -0.2%p 37.6% 37.8% 0.2%p 37.8% 37.8% 37.7% 37.7% 37.9% T-Com 37.7% 37.7% 38.8% 38.0% 38.6% 38.8% 1.1%p 37.7% 38.7% 1.0%p T-Online -9.8%p 25.0% -8.3%p 25.9% 28.0% 15.1% 23.1% 17.3% 16.1% 16.7% T-Mobile 34.5% 2.5%p 30.6% 32.9% 2.3%p 32.0% 34.3% 30.9% 31.6% 31.3% Business Customers -0.2%p 12.9% -0.2%p 13.0% 14.3% 10.6% 12.6% 12.7% 12.8% 12.7% GHS 11.2%p -14.4% 6.5%p -18.7% -2.5% -30.8% -15.5% -8.4% -7.5% -7.9% Group 34.2% 36.9% 32.1% 34.2% 34.2% 35.4% 1.2%p 34.0% 34.8% 0.9%p Cash Capex Broadband/Fixedline 13.0% 848 10.4% 478 499 775 2,122 396 540 936 T-Mobile 767 697 789 3,078 2,505 1,007 31.3% 1,592 3,512 120.6% Business Customers -20.4% 335 -10.4% 211 193 229 757 132 168 300 GHS -7.8% 184 -5.4% 128 133 201 518 56 118 174 Group 1,576 1,480 2,002 6,410 3,091 1,824 15.7% 2,928 4,915 67.9% 174 Net Income incl. Special influences 577 -1,359 1,714 1,564 1,010 943 63.4% 1,209 1,953 61.5% 949 1,951 excl. Special influences 1,222 1,152 592 3,657 1,002 -22.3% 1,913 2.0% Free-Cash-Flow before dividend 1,324 2,440 3,594 10,310 -915 1,815 37.1% 4,276 900 -79.0% Net Debt (billion) 47,067 44,596 39,543 39,543 42,635 44,533 -5.4% 47,067 44,533 -5.4% Page 4 Unaudited and preliminary Figures
Excellent market position. Delta q.o.q. Delta y.o.y. Delta% Delta% million 1 30/06/05 30/06/04 30/09/04 31/12/04 31/03/05 abs. % abs. % Broadband lines total 2 4.9 5.4 6.1 6.7 7.1 0.4 6.0% 2.2 44.9% 6.0% 44.9% of which Germany 3 4.7 5.2 5.8 6.4 6.7 0.3 4.7% 2.0 42.6% 4.7% 42.6% of which resale 4 0.0 0.1 0.2 0.5 0.7 0.2 40.0% 0.7 n.a. 40.0% n.a. Narrowband lines total 5 43.3 43.0 42.8 42.4 42.1 -0.3 -0.7% -1.2 -2.8% -0.7% -2.8% of which Germany 6 37.2 37.0 36.8 36.4 36.0 -0.4 -1.1% -1.2 -3.2% -1.1% -3.2% of which CEE 7 1.6% 6.1 6.1 6.1 6.0 6.2 0.2 3.3% 0.1 1.6% 3.3% Registered internet customers total 8 13.6 2.3% 13.3 13.4 13.5 13.6 0.0 0.0% 0.3 2.3% 0.4% Mobile Majority Holdings 80.9 10.1% 73.5 75.4 77.6 79.0 1.9 2.3% 7.4 10.1% 2.3% T-Mobile Germany 27.1 27.4 27.5 27.6 28.2 0.6 2.1% 1.1 4.2% 2.1% 4.2% T-Mobile USA 15.4 16.3 17.3 18.3 19.2 0.9 5.2% 3.9 25.0% 5.2% 25.0% T-Mobile UK 9 14.9 15.2 15.7 16.1 16.1 0.0 0.0% 1.2 7.8% -0.3% 7.8% T-Mobile Austria 2.0 2.0 2.0 2.0 2.0 0.0 0.0% 0.0 1.6% 2.4% 1.6% T-Mobile CZ 4.1 4.1 4.4 4.4 4.5 0.1 1.4% 0.4 9.5% 1.4% 9.5% T-Mobile NL 2.2 2.3 2.3 2.2 2.3 0.0 2.3% 0.0 1.2% 2.3% 1.2% CEE 10 7.8 8.1 8.4 8.4 8.6 0.2 2.3% 0.8 10.3% 2.3% 10.3% 1 Figures rounded to the nearest million. The total is calculated on the basis of precise numbers. 2 Lines in operation. 3 Since Jan. 31, 2005, broadband lines based on DSL technology for consumers have been marketed by T-Online, broadband lines excluding internal use. Historic figures adjusted. 4 Definition of resale: sale of broadband lines based on DSL technology to alternative providers outside DT. 5 The number of narrowband lines rather than channels have been reported since the first quarter of 2005. Historic figures adjusted. 6 Telephone lines excluding internal use and public telecommunication, including wholesale services. Historic figures adjusted. 7 Including MATÁV (incl. Maktel and Montenegro since Q2/05, historic figures are not adjusted), Slovak Telecom and T-Hrvatski Telecom. 8 Total calculated on the basis of customers (broadband and narrowband rates) with a billing relationship and PAYG < 30 days and PAYG < 30 days. 9 Incl. Virgin Mobile. 10 Incl. T-Mobile Hungary, T-Mobile Hrvatska (Croatia), T-Mobile SK (Slovakia), Mobimak (Macedonia) and Monet (Montenegro). (Monet incl. in Q2-numbers 2005 for the first time; historical figures adjusted.) Page 5 Unaudited and preliminary Figures
DT-Group. Content Adjusted P&L ................................................................................................................................................ 7 Unadjusted P&L ...................................................................................................................................... 8 EBITDA reconciliation ............................................................................................................. 9 Special influences in the P&L ............................................................................. 10 Special influences .......................................................................................................... 11-12 Change in scope of consolidation ............................................. 13-14 Balance Sheet .......................................................................................................................... 15-17 Maturity Profile .................................................................................................................................... 18 Debt to net debt reconciliation ....................................................................... 19 Cash capex .................................................................................................................................................. 20 Free cash flow ....................................................................................................................................... 21 Personnel ........................................................................................................................................................ 22 Currency exchange rates ............................................................................................ 23
Recommend


More recommend
Explore More Topics
Stay informed with curated content and fresh updates.