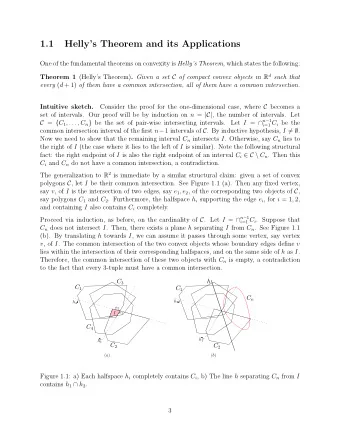
Application Monitoring Robert A. Ballance, SNL John T. Daly, LANL - PowerPoint PPT Presentation
Application Monitoring Robert A. Ballance, SNL John T. Daly, LANL Sarah Michalak, LANL Presented at CUG 2008, Helsinki, Finland Unclassified Unlimited Release SAND Number: 2008-2932C What is it? Application monitoring is the automated
Application Monitoring Robert A. Ballance, SNL John T. Daly, LANL Sarah Michalak, LANL Presented at CUG 2008, Helsinki, Finland Unclassified Unlimited Release SAND Number: 2008-2932C
What is it? Application monitoring is the automated process of tracking the real progress of an application over time –It is not platform monitoring –It is not queue monitoring –It is not utilization monitoring But it can be used to inform all of these processes!
Application monitoring stems from a simple premise
What if your jobs could talk?
What if you knew how to listen?
> cd ../../over/^H^H^H^H/back/somedir.d > ls > ls -l | less #! wrong directory. Where did I …? > cd ../../back^H^H^H^Hover/down/dir.2 > ls > head -100 myrandomoutput.log | tail
What if Ballance knew how to listen?
Telephone rings…. Hi John Hi Bob Looks like your job has stalled (again) Thanks!
But how did he know that?
Register in your scheduler job script module load jobmonitor monitor -o myjob.out --check=size User System User Start MySQL monitor jobmonitor.cgi Web monitor_job.pl .monitor jobmonitor.conf job_status job_status.pl monitor_cron.sh (command) System Scheduler update_monitored_jobs.pl
Queued Dequeued Running Initial OK Any running Stalled Exited state N Con fi g Check Check FS Probably Errors Failed Timeout Timeout Hung Holding states
What can it check? File size increasing decreasing Access time increasing Modification time increasing GREP out number increasing decreasing Still running? Count files matching increasing decreasing Count files on remote increasing decreasing system
Where can you check? ✓ Where can you check ✓ job_status (command line) ✓ Web ✓ What can you see? ✓ You can see your jobs ’ status ✓ Your jobs ’ history, including the succession of comparison values ✓ Job description, state, etc. ✓ Administrators can view all jobs
What if your job had meaningful things to say?
Why isn ’ t system monitoring good enough? •Preliminary investigations at Los Alamos indicate that as much as two-thirds of system unavailability to the application may be unaccounted for in system monitoring data because –System software interrupts (est. 50% of total interrupts) are frequently not tracked –Common-cause failures that may interrupt multiple applications are frequently counted as a single interrupt by system monitoring •NEED: A method of monitoring reliability from the application ’ s perspective
Application MTTI is a better metric than system MTBF for quantifying the user ’ s experience First order approximation of application mean time to fatal error demonstrates super-linear per processor reliability scaling A -- Inverse Proportionality B -- First Order Approximation C -- Exact (Contiguous Nodes) D -- Exact (Random Nodes) E -- Exact (Worst Case Nodes) k -- number of processors
What application data is required? • k j ─ # of nodes allocation to the application • ∆ t j ─ time that the application spent running • m j ─ # of interrupts that occurred during the run These should be measured for each job “j”
0.35 Data from application 10.4 0.35 0.15 monitoring can be used 0.75 0.95 to predict how 10.2 effectively jobs of M N 10.0 0.55 various sizes will run 9.8 9.6 10.4 0 500 1000 1500 2000 M 1 10.2 The paper provides the 0.35 0.75 M N 0.55 10.0 0.95 mathematical and 0.15 statistical basis 9.8 9.6 0 500 1000 1500 2000 M 1
Utilization? Performance? Scaling? What else can app monitoring data reveal? Availability? Others...?
Questions only the job can answer •Is the job making progress? •At what rate is it making progress? •How frequently is it interrupted? •What are the causes and symptoms of the interrupts? •Should the system intervene (e.g., to kill or restart the job)? •Should the system operators or user be notified? •How much time and storage are spent preparing for restarts?
•Tri-Lab (LANL, LLNL, SNL) Application Monitoring Project •Phase 1 is this year •Tools, techniques, libraries, algorithms to enable a platform-independent app monitoring system
Recommend
More recommend
Explore More Topics
Stay informed with curated content and fresh updates.
