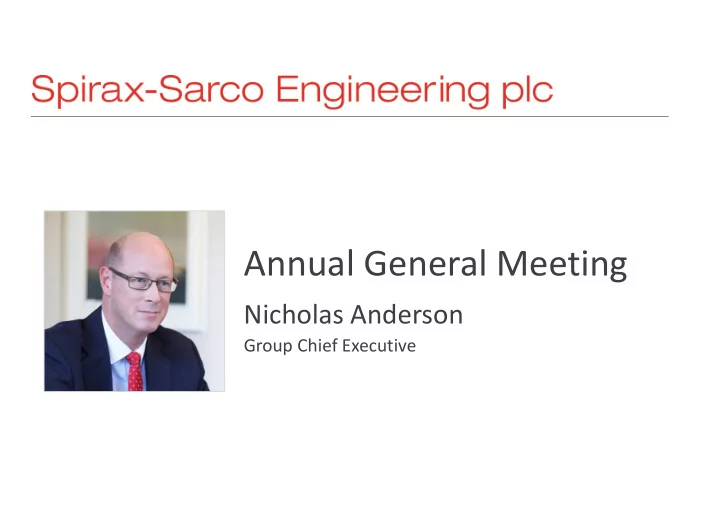

Annual General Meeting Nicholas Anderson Group Chief Executive
2015 Results Solid set of results against a challenging background 2015 2014 Change Constant currency Revenue £667.2m £678.3m -2% +2% Operating profit £152.4m £153.0m 0% +4% Operating margin 22.8% 22.5% +30 bps +40 bps Pre-tax profit £151.1m £151.1m 0% +4% EPS 142.6p 140.4p +2% +6% DPS 69.0p 64.5p +7% +7% • Organic sales up 2%; Operating profit up 4% • Currency headwind of 4% on sales and profit • Operating margin increased to 22.8% • Robust cash generation, 95% cash conversion • Dividend increased 7% • Implementing strategy for growth 2
2015 Results Industrials sector comparison Company Organic Organic Operating Operating PBT change EPS change growth 2014 growth 2015 margin 2014 margin 2015 Bodycote 4% -3% 18.2% 18.0% -8% -10% GKN 4% 2% 9.2% 8.8% -2% -5% IMI 2% -5% 17.5% 15.2% -21% -20% Melrose -3% -17% 20.0% 14.3% -107% -3% Morgan IM 2% -1% 12.8% 12.0% -6% -7% Rotork 2% -5% 26.4% 22.9% -21% -21% Senior 5% -3% 13.6% 12.6% -3% -3% Spectris 2% 0% 16.9% 15.2% -9% -8% Spirax Sarco 4% 2% 22.5% 22.8% 0% 2% Vesuvius 4% -8% 9.9% 9.4% -15% -16% Weir 9% -21% 18.4% 13.5% -46% -45% Average 3% -5% 16.9% 15.0% - - Median 4% -3% 17.5% 14.3% - - Source: Numis, Research Report , 7th March 2016 3
Global economic slowdown Annual IP growth rates by quarter 2012-2016 Projected Actual 5.0% Developed (OECD) Feb 16 Emerging (Non-OECD) Feb 16 Global Feb 16 Developed (OECD) Jun 15 Emerging (Non-OECD) Jun 15 Global Jun 15 4.0% 3.0% 2.0% 1.0% 0.0% -1.0% Source: CHR Economics – June 15 & Feb 16 -2.0% Q1 Q2 Q3 Q4 Q1 Q2 Q3 Q4 Q1 Q2 Q3 Q4 Q1 Q2 Q3 Q4 Q1 Q2 2015 2012 2013 2014 2016 4
Currency headwinds Impact on: 2014 2015 combined Sales 6.4% 3.6% 10.4% Profit 10.2% 4.1% 14.7% Average exchange rates 2013 2014 % 2014 2015 % Spirax weighted index 100.0 106.8 -6% 100.0 103.8 -4% Bank of England index 81.7 87.1 -6% 87.1 91.4 -5% US$ 1.57 1.65 -5% 1.65 1.53 8% Euro 1.18 1.24 -5% 1.24 1.38 -10% RMB 9.66 10.15 -5% 10.15 9.60 6% Won 1,716 1,734 -1% 1,734 1,728 0% Brazilian Real 3.41 3.88 -12% 3.88 5.11 -24% Argentine Peso 8.65 13.32 -35% 13.32 14.28 -7% SA Rand 15.16 17.85 -15% 17.85 19.57 -9% 5
Implementing our strategy for growth Notable progress in 2015 • Stepped up training and development; new Spirax Sarco Academy • Implementing enhanced Customer Value Propositions • Increased sector focus: Food & Bev., Healthcare, Chemical, OEMs • Growth of Controls & Thermal Energy Management products • Continued development of innovative new products • Advanced the Global Excellence in Supply Chain initiatives • Strategic investment in India plus five new direct sales companies • Completed five acquisitions and two disposals • Improved sustainability; reduced global carbon emissions by 13% Delivering self-generated growth that outperforms our markets 6
Investing for growth Spirax Sarco India • £12 million investment • Headquarters in Chennai, offices in Mumbai and Delhi • 40 people; 35% sales, 40% operations • Building complete and operational, official opening in June Chennai 7
Our global coverage and expansion 77 operating units* in 43 countries * Operating units include operating companies, branches and Associate, at time of publication Spirax Sarco Egypt, trading January 2015 Flow Smart, USA, acquired Control Valve November 2015 Asepco, USA, Engineering Ltd, acquired April 2015 acquired April 2015 Watson-Marlow Japan, trading July 2015 Spirax Sarco Peru, trading January 2015 Watson-Marlow Taiwan, trading September 2015 Operating units* Spirax Sarco Vietnam, (43 countries) trading January 2016 Spirax Sarco India, trading July 2015 Sales offices (14 countries) Spirax Sarco Distributors Colombia, trading Watson-Marlow Chile, September 2015 (58 countries) trading July 2015 Serving customers in over 110 countries 8
Operating margin improvements Not at the expense of growth • Margin improvements not at the Operating margin expense of growth 33.0% • Focus on improved performance 31.0% though: 29.0% - price management 27.0% - efficiency improvements 25.0% 22.8% 22.5% - cost reductions 23.0% 22.0% 20.6% 20.6% 21.0% 20.2% • EMEA improved 350 bps, 19.5% 19.0% despite recent strong exchange 19.7% 19.4% 17.0% headwinds 17.0% 16.0% 15.8% 15.0% 2010 2011 2012 2013 2014 2015 EMEA Asia Pac Americas WMFTG Group 9
AGM statement For the 4 months ending 30 th April Trading conditions Performance Outlook • Organic sales growth • Global IP remains uncertain • Global industrial production (IP) maintained at 2015 levels growth around zero • We remain focused on our • Operating profit ahead • Small deterioration in Developed strategic priorities to self- • Currency movements now generate growth economies positive; over 2% tailwind on • Provided there is no material - European markets overall sales and 3% on profits, vs. stable, IP <1% deterioration in trading average 2015 rates conditions, the Board expects - North America negative • Net cash balance increased to make progress in 2016 • Small improvement in Emerging from £5 million at 31 st economies December to £31 million at 30 th April - Asia Pac small improvement - Latin America firmly negative 10
Questions?
Recommend
More recommend