Announcements Chapter 5 post-lab write-ups are due at the beginning - - PowerPoint PPT Presentation

▶
announcements
SMART_READER_LITE
LIVE PREVIEW

Announcements Chapter 5 post-lab write-ups are due at the beginning - - PowerPoint PPT Presentation

Announcements Chapter 5 post-lab write-ups are due at the beginning of your Chapter 6AB lab Various ways for calculating k cat from your post-lab write-up data; check blackboard for a guide Chapter 6AB begins Wednesday, Nov 20 th and


slide-1
SLIDE 1

Announcements

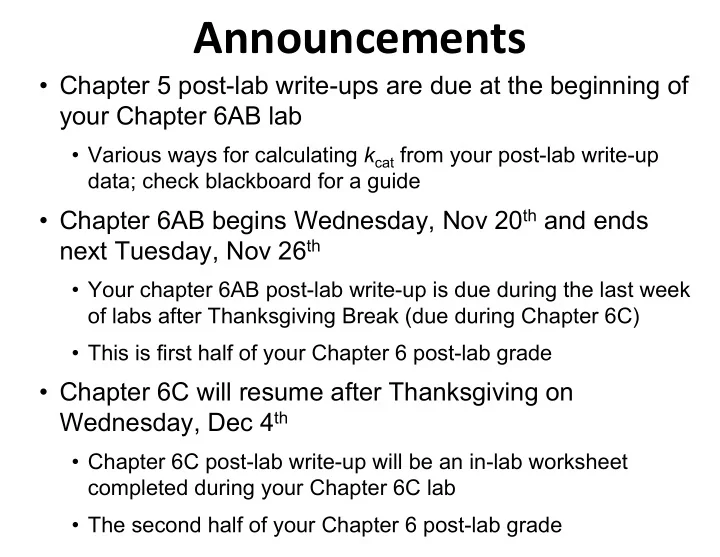
  • Chapter 5 post-lab write-ups are due at the beginning of

your Chapter 6AB lab

  • Various ways for calculating kcat from your post-lab write-up

data; check blackboard for a guide

  • Chapter 6AB begins Wednesday, Nov 20th and ends

next Tuesday, Nov 26th

  • Your chapter 6AB post-lab write-up is due during the last week
  • f labs after Thanksgiving Break (due during Chapter 6C)
  • This is first half of your Chapter 6 post-lab grade
  • Chapter 6C will resume after Thanksgiving on

Wednesday, Dec 4th

  • Chapter 6C post-lab write-up will be an in-lab worksheet

completed during your Chapter 6C lab

  • The second half of your Chapter 6 post-lab grade
slide-2
SLIDE 2

Chapter 6: Isolation of Plasmid DNA

Purpose of Week 1: A) Isolate plasmid DNA from E. coli B) Determine DNA concentration by two methods

 UV absorbance (Cary‐60 UV/Vis)  Gel electrophoresis (agarose gels)

slide-3
SLIDE 3

Our Plasmids

  • We are isolating pGEM3 and

pGEM4 from E. coli

  • Each contains:
  • REL Gene
  • SP6 Promoter
  • Ampicillin resistance gene
  • Origin of replication
  • Restriction enzyme recognition sites
  • You will need to identify which of

your plasmids is pGEM3 & which is pGEM4

  • Include a labeled map with your lab

report

Maps are on p. 205 of the Lab Manual AmpR AmpR

  • ri
  • ri

Rel Rel

SP6 promoter SP6 promoter

Ahd I 3.57 Ahd I 3.57 Pvu II 0.55 Pvu II 1.92 Pvu II 2.50 Pvu II 2.50 pGEM3-Rel 5.27 Kb pGEM4-Rel 5.27 Kb

slide-4
SLIDE 4

Overview of Mini‐Prep for Plasmid Isolation

Need to separate nucleic acids from cell membranes and proteins

  • Step 1: Cell lysis by detergents: SDS

−

Detergents will disrupt cell membrane and expels cytoplasm

  • Step 2: Addition of potassium acetate: Precipitates detergents and high molecular

weight impurities

−

Detergents & membrane debris will be pelleted from nucleic acids and proteins

  • Step 3: Extraction with Phenol / Chloroform: Removes proteins

−

Separates nucleic acids in an aqueous layer from the lipids in the organic layer and denatured, precipitated proteins at the interface

  • Step 4: Precipitation of Nucleic Acids using 100% ethanol

−

Nucleic acids (DNA & RNA) are precipitated and pelleted out of solution

Steps 1 – 4 will allow you to generate mini‐prep plasmid DNA samples

  • Step 5: Digest RNA using RNase during sample prep for gel electrophoresis

−

RNA is enzymatically digested, but will still contribute to 260 nm absorbance values (keep this in mind during this week’s lab)

slide-5
SLIDE 5

Bacterial Cells Bacterial cytosol expelled into mini‐prep solution Detergent Precipitate Supernatant: Plasmid DNA, bacterial RNA, carbohydrates, proteins, lipids Bottom organic layer: Lipids Top aqueous layer: Plasmid DNA, RNA Wash nucleic acid pellet Plasmid DNA Pellet: Unlysed cells, cell debris and attached chromosomal DNA

Treat with KOAc Centrifuge Phenol / Chloroform Extraction Ethanol Precipitation Resuspend with TE buffer

Flow Chart for Plasmid Mini‐Prep

Centrifuge, Lysis with NaOH and SDS

slide-6
SLIDE 6

Calculating DNA Concentration (spec)

  • UV Absorbance
  • Dilute 2 µl of mini‐prepped plasmid with 998 µl of TE buffer (1:500 dilution)
  • Record A260 nm values from Cary‐60 specs
  • These A260 nm values are direct readings for the units of O.D./mL
  • These initial O.D./mL values reflect the diluted sample in 1 mL
  • Back‐calculate to the concentrated mini‐prep sample you isolated by multiplying by

the sample prep dilution factor (i.e., multiply by 500 for this example)

In post‐lab, calculate [DNA] from O.D. – optical density units

– 1.0 O.D. = Amount of nucleic acid that gives A260 = 1 in 1 ml

  • For DS DNA: 1.0 O.D. = 50 µg

– 20 O.D./mg DNA

  • For RNA: 1.0 O.D. = 40 µg

– 25 O.D./mg RNA

slide-7
SLIDE 7

Agarose Gel Electrophoresis

  • Relative DNA migration rates depends on:
  • Size and conformation (supercoiled versus closed

circular)

  • Concentration of agarose in the gel
  • Applied voltage
  • Your gel will melt if it gets too hot!
  • All DNA has the same charge‐to‐mass ratio with a

negative charge

  • Your negatively charged DNA will migrate toward the

positively charged red wire (cathode)

slide-8
SLIDE 8

Ethidium Bromide Staining

  • Ethidium Bromide (EtBr) is an interchalating agent

Be very careful when handling EtBr as it is a potential carcinogen

  • Will fluoresce under UV light when bound to nucleic acids

From Wikimedia commons

slide-9
SLIDE 9

Observing Plasmid DNA

  • An Ethidium Bromide stain is used to observe

DNA

  • Multiple forms of Plasmid DNA:
  • Supercoiled circular DNA
  • Nicked circular DNA
  • Linear DNA
  • Our system’s migration pattern:
  • Nicked circular slowest
  • Linear
  • Supercoiled fastest

http://arbl.cvmbs.colostate.edu/hbooks/genetics/biotech/gels/supercoils.jpg

slide-10
SLIDE 10

Calculating DNA Concentration (gel estimation)

  • Agarose Gel
  • Each gel will have two markers:
  • Supercoiled ladder – to measure size of supercoiled DNA sample
  • Minnesota ladder – to measure mass of supercoiled DNA sample
  • For measuring DNA concentrations:
  • Compare your sample’s signal intensity with a band in the

Minnesota ladder

  • Estimate the mass of DNA in your sample
  • Divide your sample’s mass by the volume of DNA used in the

corresponding lane

  • For example: 30 ng of estimated mass divided by 2 µl of DNA used

in sample = 15 ng/µl

Look at marker tables in p. 192

slide-11
SLIDE 11

Supercoiled ladder (to measure size) Minnasota ladder (to measure mass)

Look at marker tables in p. 192

slide-12
SLIDE 12

Visually removing bacterial RNAs

S M A B A B

  • RNase +RNase
  • Bacterial RNAs are released into

purification along with plasmid DNA

  • 260 nm wavelength on the UV/Vis

detects the nucleobases, which are present in both DNA and RNA

  • Your UV/Vis-based DNA

concentrations will be significantly greater than your gel-based estimations

  • We will also remove E. coli RNAs

in week 2 to visualize smaller digested DNA fragments

S = supercoiled ladder M = Minnesota ladder A = plasmid A B = plasmid B

slide-13
SLIDE 13

Chapter 6AB Procedure

Workflow for Chapter 6 week 1:

  • Isolate plasmid DNA
  • Cast a 1% agarose gel
  • Measure nucleic acid concentration with UV-Vis spec
  • Prepare samples and gel tank
  • Load samples and run gel
  • Stain, destain, and image gel on UV-gel doc

Make sure to save your plasmids for week 2! If you are taking Biochemistry 2, you will save your plasmids for Lab 8 next semester!

slide-14
SLIDE 14

Procedure: Chapter 6 – Week 1

Lysing E. coli cells

  • Get 2 aliquots of cells transformed with Plasmid A & B
  • In week two, you will use restriction enzymes to determine which is

pGEM3‐Rel and pGEM4‐Rel

  • Centrifuge 1 min – remove supernatant
  • Add 100 μl of GTE and vortex to resuspend cell pellet
  • Add 200 μl of NaOH/SDS lysis solution, mix by inversion and

ice for 5 min (do not lyse for more than 5 min)

  • Add 150 μl of potassium acetate solution, mix by inversion
  • Centrifuge for 5 min at top speed – pipette supernatant into a

clean eppendorf tube, discard pellet

slide-15
SLIDE 15

Procedure: Chapter 6 – Week 1

  • Plasmid Mini‐Prep
  • Add 1:1 phenol:chloroform (v/v) to your samples
  • Pull from the bottom layer of the stock bottle

– Phenol is highly toxic, can cause severe burns and throat

irritation

– This step MUST be done in the hood!

  • Vortex/shake your samples vigorously for 30 sec
  • Centrifuge to separate aqueous and organic phase
  • Transfer top aqueous phase to clean labeled tube
  • Discard bottom layer and all phenol:chloroform waste

directly in the hood

slide-16
SLIDE 16

Procedure: Chapter 6 – Week 1

  • Plasmid Mini‐Prep:
  • Add cold 100% ethanol to aqueous layer, mix well
  • Centrifuge ~15‐30 minutes
  • Remove supernatant, wash pellet with cold 70% ethanol
  • Centrifuge 1‐2 minutes
  • Remove supernatant and air dry – be careful not to remove

pellet at the same time

  • Add 35 μL TE, vortex/pipet to dissolve pellet
  • Final sample = mini‐prepped plasmid DNA
slide-17
SLIDE 17

Procedure: Chapter 6 – Week 1

  • Agarose Gel Electrophoresis – TF's will demo in lab
  • Prepare Gel:

– Prepare casting tray using gel box walls – Pour into casting tray, add comb, and let solidify

slide-18
SLIDE 18

New Procedure: Chapter 6 – Week 1

  • Agarose Gel Electrophoresis
  • Sample Preparation: For Each Plasmid A & B, set up the following

–

– You will generate a total of 4 sample preps in your group – Incubate your samples at 37°C for 10 min to digest the RNA before

loading onto your gel

  • Load Gel:

– Run gel with another group: 8 samples + 2 standards/ gel – 2 Standards for each gel: See table p. 192

  • Supercoiled DNA Marker
  • DNA Mass, Minnesota Molecular

Sample No RNase RNase digest Plasmid DNA: 0.1 – 0.2 OD units 2‐7 µL 2‐7 μL 6X Sample Buffer 3 µL 3 μL 1 mg/ mL RNase (TF bench) ‐‐‐‐‐‐‐‐ 2 μL DI Water 15 µL – (Plasmid DNA µL) 13 μL – (Plasmid DNA μL) Total Volume 18 µL 18 µL

slide-19
SLIDE 19

Procedure: Chapter 6 – Week 1

  • Agarose Gel Electrophoresis
  • Run Gel:

– What is the charge on DNA? Which direction will it run? – Run gel at 100 ‐ 150 V until dyes separate – If you run the gel faster it will MELT!

  • Staining and De‐staining of Gel:

– Stain in ethidium bromide, 10 – 15 min

– Ethidium Bromide is a known carcinogen/mutagen! – Use gloves and dispose of waste properly!

– De‐stain in water, 2 min

  • Image Gel:

– Take picture of agarose gel on gel dock

slide-20
SLIDE 20

Procedure: Chapter 6 – Week 1

  • Determination of DNA Concentration
  • Before running gel – Measure concentration by UV‐

absorbance

– Dilute 2 μl of DNA to 1.0 ml in TE buffer

– Adjust concentration as necessary so that 0.01 < A260 < 1.0

– Do not use more than 6 – 7 μl for UV‐absorbance exercise – Convert these O.D./mL measurements into mg/mL of DNA

  • After gel is complete – Calculate concentration from gel

– Use DNA mass standard and estimate relative intensity of each

band

– Divide this amount by the amount of DNA in the sample

– 100 ng of Plasmid DNA in the band / 2 μl plasmid DNA in gel

= 50 ng/µl

  • Compare the results of the two methods in your post‐lab
slide-21
SLIDE 21

Chapter 6 Week 1:

Before the lab period, you should have:

Completed your prelab Title, date, introduction, procedures, and a flowchart of your plasmid isolation procedure Turned in your Chapter 5 post-lab write-up

At the end of lab, you should have:

Isolated your plasmid DNA (save DNA preps for week 2 and BI422) Ran your samples on an agarose gel Stained and imaged your gel