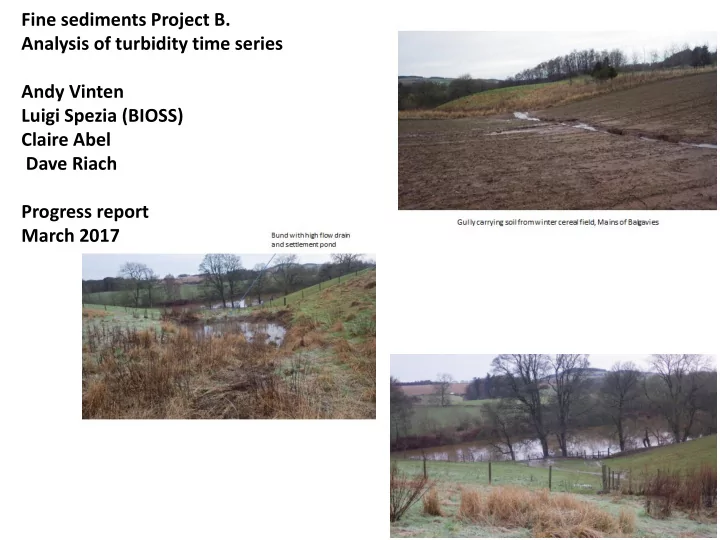

Fine sediments Project B. Analysis of turbidity time series Andy Vinten Luigi Spezia (BIOSS) Claire Abel Dave Riach Progress report March 2017
Project B. Analysis of turbidity time series • Many catchments of varying typology have NTU/Q/R/chem time series • Could NTU time series help with BACI analysis of fine sediment impact before/after WFD intervention? Erosion Flow Hjulström-Sundborg Velocity Diagram Transport (cm/s) Deposition Grain size (mm) 1. Could variance of replicate NTU measurements be used to assess particle size distribution during events? 2. Could hidden Markov analysis identify specific turbidity “states”?
Turbidity variance during storm event at Burnside (March 2017)
Progress with hidden Markov analysis • Turbidity data analysis via Markov switching Autoregressive models (MSARMs) with m hidden states and autoregressions of order p. • DATA : Wemyss 2011 & 2012; 15min; (3.43% missing ) Covariates: Discharge (2.1%); Rainfall (5.8%) LN (NTU) TIME • the hidden chain is a useful tool to efficiently model turbidity data, as it allows obtaining a fitted series close to the actual. • Clustering the observations in three hidden states looks reasonable, although we haven’t found yet the physical interpretation of the three hidden states. • Covariates not improving model fit • The missing values in the three series might have an effect in masking the interpretation.
Summary 1 ) highlights from year 1 research – Field data capture at Burnside started in March 2017 – Markov method established but not yet a predictive tool 2) plans for years 2/3 Year 2: 2 potential new SUDS sites on Lunan catchment Try Markov analysis on different time series in Lunan water (eg Burnside) Year 3: Look at other catchments 3) any issues/challenges ahead – Turbidity probes problematic, just bought 3 replacements 4) any integration across the RESAS programme – Should be integrated with catchment typology work (year 3?)
Recommend
More recommend