SLIDE 21 21
✂ ✄ ☎ ✆
✞ ✟ ✠ ✡☛ ☞ ✌ ✍ ✎ ✝ ✞ ✟ ✠
100 40 50
Representation
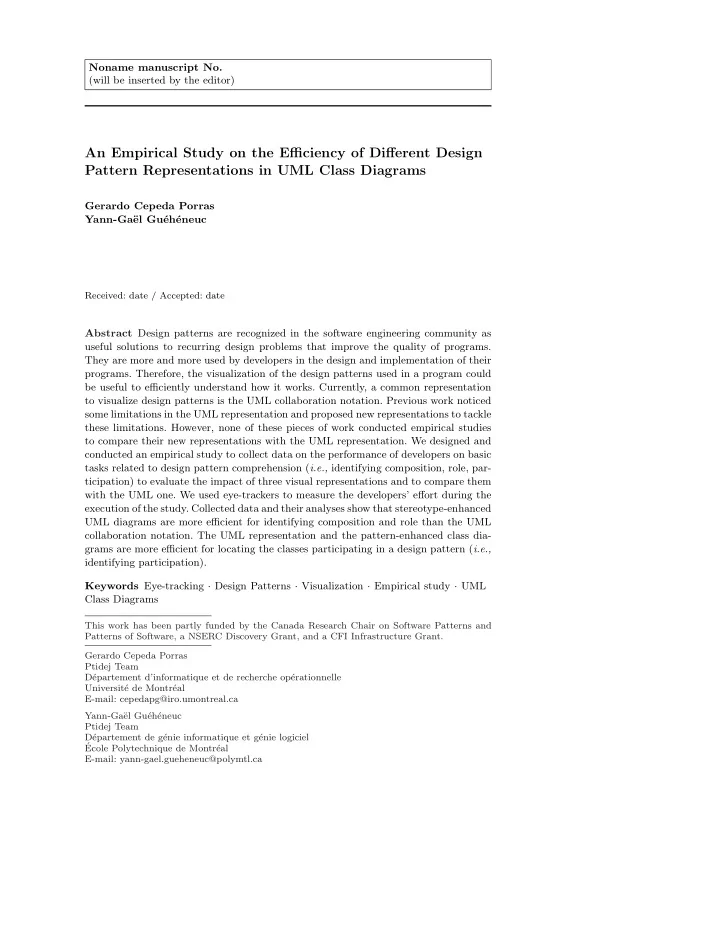
U10 S10 G10 D10
AFD (ms )
450,000 400,000 350,000 300,000 250,000 200,000 150,000
p-values:
H01: 0,574 H02: 0,914 H03: 0,145 329,923 236,121 281,664 286,894
Representation
U10 S10 G10 D10
ROAF (#)
1,000 ,900 ,800 ,700 ,600 ,500 ,400 ,300
p-values:
H01: 0,0005 ---> Ha1.2 verified H02: 0,576 H03: 0,018 ---> Ha3.2 verified 0,764 0,554 0,857 0,525
Representation
U10 S10 G10 D10
ROAFT (ms)
1,000 ,900 ,800 ,700 ,600 ,500 ,400 ,300
p-values:
H01: 0,004 ---> Ha1.2 verified H02: 0,817 H03: 0,028 ---> Ha3.2 verified 0,819 0,63 0,884 0,633
- Fig. 12 Data distribution for Task Role, diagrams of 15 classes.
4.4 Data Analysis of the Impact of Secondary Factors in 15 Classes Diagrams The results presented in Sections 4.1, 4.2 and 4.3 show: – For Task Participation: a better performance in CAP for users using Representation UML over all other representations and also less effort in subjects with respect to
- Dong. No statistically significant differences on subjects’ effort were reported when
comparing UML to the other two representations. – For Task Composition: subjects performed well in most representations for CAP, despite this fact, only Representation Dong requires less effort when compared to UML. – For Task Role: Representation Dong has better values in CAP than the other three representations and was again the only representation to require less effort when compared to UML. Considering the variances in the metrics reported in previous sections, we inves- tigated if the levels of knowledge in design patterns could mitigate the results. We eliminated the mitigating variable of JHotDraw Knowledge because more than 80% of the subjects where classified on the basic level. Therefore, we are sure that this variable will not have an impact on the presented results. For simplicity reasons and because none of our subjects had knowledge of design patterns, we decided to group design patterns knowledge in two categories: 1 for basic- medium level and 2 for the expert level. We also chose to study only the values of answers given and ROAF. Figure 13 (left) shows the impact of design pattern knowledge on Task Composition. With Representation Gamma, subjects who have very good design pattern knowledge (level 2) perform better than subjects having basic or average knowledge (level 1). We