
AmFIRST REIT Financial Results For The Financial Period Ended 30 September 2012 6 November 2012 1
Contents • Overview Slide 3 • Financial Performance for the quarter ended 30 September 2012 Slide 4 • Statement of Financial Position Slide 5 • Strategically Located Portfolio of Buildings Slide 6 • Unit Price Performance during 1 April 2012 to 30 September 2012 Slide 7 2
Overview Item Description Approved Fund Size 686,401,600 units Manager Am ARA REIT Managers Sdn Bhd Listing Date 21 December 2006 Unit Price RM 1.10 (Closing as at 28 September 2012) Market Capitalization RM 755.0 million (as at 28 September 2012) Borrowings/Gearing Borrowings/Gearing RM 345.1 million / 28.7% (as at 30 September 2012) RM 345.1 million / 28.7% (as at 30 September 2012) No. of Investment Properties 8 ( as at 30 September 2012) Sector / Type of Properties Commercial office & retail RM 1,182.7 million (as at 30 September 2012) Assets Under Management Commercial (78%) & Retail (22%) Total Assets RM 1,203.1 million (as at 30 September 2012) Net Asset Value per unit RM 1.2075 (as at 30 September 2012) No. of Unitholders 12,854 (as at 28 September 2012) 3
Financial Performance Current Vs Preceding Corresponding Period For The Financial Period Ended 30 September 2012 Current Preceding YTD Ended YTD Ended % RM ‘000 Change 30 September 30 September 2012 2011 Gross Revenue 53,440 46,178 +15.7 Property Expenses (17,607) (14,907) +18.1 Net Rental Income 35,833 31,207 +14.8 Interest and Other Income 270 78 +246.2 Total Income 36,103 31,348 +15.2 Non-Property Expenses (3,711) (3,307) +12.2 Interest Expense (10,722) (8,757) +22.4 Net Income for the period 21,670 19,284 +12.4 Gain/(loss) arising from measuring non-current financial 234 (333) +170.3 liabilities measured at amortized cost Total Comprehensive Income for the period 21,904 18,951 +15.6 Total Comprehensive Income for the period is made up as follows: - Realized 21,670 19,284 +12.4 - Unrealized 234 (333) +170.3 21,904 18,951 +15.6 4
Statements of Financial Position RM ‘000 As at As at 30 September 2012 31 March 2012 (Unaudited) (Audited) No. of Properties 8 8 Investment Properties 1,182,676 1,179,844 Other Assets 20,463 18,698 Total Assets Total Assets 1,203,139 1,203,139 1,198,542 1,198,542 Borrowings (345,155) (550,000) Other Liabilities (29,145) (30,777) Net Asset Value (NAV) 828,839 617,765 Unit in Circulation (‘000 unit) 686,402 429,001 NAV Per Unit (RM) 1.2075 1.4400 Market Capitalization 755,042 510,511 Gearing (%) 28.7% 45.9% 5
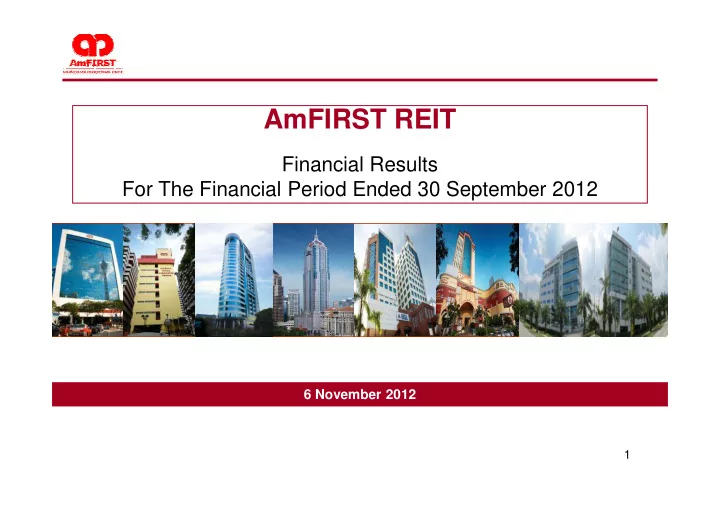
Strategically Located Portfolio of Buildings Bangunan AmBank Menara Menara Wisma The Summit Prima 9 Prima 10 AmBank Group AmBank AmFIRST AmFIRST Subang USJ Cyberjaya Cyberjaya ( Formerly known (formerly known Group Leadership (“MAB”) (“The (“Prima 9”) (“Prima 10”) as Menara as Kelana Brem (‘BAG”) Centre Summit”) Merais) Towers ) (“AGLC”) Golden Golden Golden Petaling Kelana Subang Location Prima 9 Prima 10 Total Triangle Triangle Triangle Jaya Jaya Jaya NLA 360,166 57,801 458,187 159,001 285,461 1,024,549 111,224 100,272 2,556,661 (sq. ft.) Tenure 99-year Freehold Freehold Freehold 99- year Freehold Freehold Freehold Car Park Lots 522 57 776 324 645 1,966 374 310 4,993 RM237.5 Valuation* RM20.7m RM306m RM67.8m RM111m RM302.2m RM72.9m RM61.7m RM1,179.8m m ^Retail- 93.8% Occupancy ** 100.0% 100.0% 96.5% 71.3% 71.0% 100.0% 100.0% 90.3% ^Office- 72.8% * As at 31 March 2012 ** Committed occupancy as at 30 September 2012 ^ Excluding hotel 6
Unit Price Performance 1 April 2012 to 30 September 2012 1.30 3,500 3,000 1.25 2,500 1.20 2,000 1.15 1,500 1.10 1.10 1,000 1,000 1.05 500 162 1.00 - 02/4 06/4 12/4 18/4 24/4 30/4 07/5 11/5 17/5 23/5 29/5 04/6 08/6 14/6 20/6 26/6 02/7 06/7 12/7 18/7 24/7 30/7 03/8 09/8 15/8 23/8 29/8 05/9 11/9 18/9 24/9 28/9 Closing Price (RM) Volume Traded ('000) Highest RM1.23 / Lowest RM1.02 7
Disclaimer � The information contained herein does not carry any right of publication or disclosure to any other party. Neither this proposal nor its content may be used for any other purpose without prior written consent of Am ARA REIT Managers Sdn Bhd. � The information may contain forward-looking statements that involves risks and uncertainties. Prospective investors are cautioned that actual results may differ materially from those set forth in any forward-looking statements herein as a result of a number of risks, uncertainties and assumptions. � The information does not constitute an offer or invitation to purchase or subscribe for any shares in the REIT. Any decision to purchase shares in the offering should be made shares in the REIT. Any decision to purchase shares in the offering should be made solely on the basis of the information contained in the prospectus to be published in due course in conjunction with the listing exercise. � Am ARA REIT Managers Sdn Bhd expressly disclaims any and all liabilities to any parties or representations, expressed or implied, contained in or omissions from the documents or any other written or oral communications transmitted as a result of the circulation, publication, reproduction or use of this document. 8
THANK YOU THANK YOU 9
Recommend
More recommend