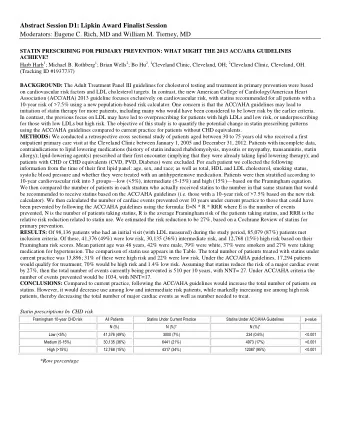
Affordability Work Group Meeting 4 April 19, 2019 A service of - PowerPoint PPT Presentation
Affordability Work Group Meeting 4 April 19, 2019 A service of Maryland Health Benefit Exchange Agenda Welcome Guest Speaker: Cheryl Parcham, Director of Access Initiatives, Families USA Q & A Guest Speaker: Stan Dorn, Director of the
Affordability Work Group Meeting 4 April 19, 2019 A service of Maryland Health Benefit Exchange
Agenda Welcome Guest Speaker: Cheryl Parcham, Director of Access Initiatives, Families USA Q & A Guest Speaker: Stan Dorn, Director of the National Center for Coverage Innovation and Senior Fellow, Families USA Q & A Guest Speaker: Linda Blumberg, Institute Fellow, Urban Institute Q & A Work Group Recommendations Draft Public Comment Adjournment 2
Cheryl Parcham Families USA Director of Access Initiatives
Why Standardized Plans? Presentation to Maryland Exchange Cheryl Fish-Parcham, Director of Access Initiatives April 19, 2019 Dedicated to creating a nation where the best health and health care are equally accessible and affordable to all
Why Standardized Plans Families USA’s Prior Research “Federal Standardized Health Insurance Plans Could Help Improve Access to Care Without Raising Premiums” (2016 study with Milliman) • The federal standardized silver plans would have premiums that are comparable to current silver marketplace plans that cover little to no services before the deductible. • Offering these standardized plans could improve access to outpatient care without driving up premiums “Designing Silver Plans With Affordable Out -of- Pocket Costs” (2014) “Non -Group Health Insurance: Many Insured Americans with High Out-of- Pocket Costs Forgo Needed Care” (2015): ¼ with year round coverage went without needed care “Improve the Display of Plan Information on Marketplace Websites to Help Enrollment” (2016) • Assisters/consumers need info on pre-deducible service and out-of-pocket drug costs 5 Sources
Consumers go without needed care if they can’t afford up -front costs In 2014, in the nongroup market, 22% of adults with incomes below 250% of poverty had deductibles of $3000 or more; nearly 30% of adults with incomes 250-400% of poverty had deductibles of $3000 or more per person. Adults in high deductible plans were more likely than those with deductibles below $1500 to report going without care because they couldn’t afford it. 6 Sources
Consumer needs vary, but for some, up-front cost is key • Very sick consumers will spend through a deductible anyway; they may care more about out-of-pocket maximums • Consumers with savings may want HSA compatible plans – and states with standardized plans do allow this as an option • But consumers also want to know that for the premiums they pay, they will in fact have access to health services – and for many, deductibles either pose an insurmountable barrier, or make plans unattractive. • Families USA’s 2016 national survey of assisters showed problems finding pre -deductible services: – Half of assisters knew of some plans that offered pre-deductible services beyond primary care – 74% said pre- deductible services were always or often important to consumers’ plan churches – Only 40% of assisters said they could determine which plans in their area offered pre-deductible services in addition to preventive care. 7 Sources
Why Standardized Plans: Some States’ Perspectives Assure availability of pre-deductible services: Improve access Ease consumers’ task of comparing plans Predictability – consumers know what they are getting (WA’s consideration) Active purchaser: plans compete based on price (MA) Can shape products to suit consumer needs statewide (OR) Simplicity (VT). (Small population, two issuers, stable market.) 8 Sources
Examples of Pre-Deductible Services In Some 2019 Silver Standard Plans Is this service pre-deductible? DC CA MA (high- VT silver) Not Outpatient primary care/mental Yes Yes Yes Yes health Outpatient specialty Yes Yes Yes Yes Drugs: generic Yes No Yes Yes Drugs: preferred No No Yes No Inpatient No No No No Outpatient surgery Yes Yes No No Labs No Yes No Emergency Dept No Yes No Urgent care Individual deductible $3500 $2500 $2000 $2800 Separate drug deductible? $250 $200 No $300 9 Sources
How does enrollment in standard and non-standard plans compare? Some examples No clear preference (MA); Consistently, about 68% choose standard (NY); Standard enrollment consistently higher by substantial margin (VT) 10 Sources
How have states altered standard plans over time? • All states make minor changes to accommodate changes in the AV calculator • Some states require silver plans to be at highest possible AV level; this can result in more pre- deductible services and maximize the price of a “benchmark” plan that becomes the basis for premium tax credits. • Some states have assured a high AV value bronze plan, either on or off-exchange, for unsubsidized consumers affected by silver loading. They may also require a low AV gold plan. • MA required a broad network plan, and an optional alternate network plan prior to ACA. They later allowed issuers to offer non-standard plans in addition. AV requirements altered its offerings. In 2016, MA reduced the number of allowable non-standard plans to simplify shopping. They have added requirements regarding pediatric dental and opioid treatment and considered VBID. In 2018, they urged non-subsidized consumers to use off- exchange plans due to silver loading, and required a “low - AV gold” and a “high AV bronze” offering • CT requires standard to be the issuers lowest price silver. Began offering an additional low AV silver in 2019, targeted at unsubsidized enrollees, that is not required to be priced low. Considered requiring a tiered network plan, but hasn’t. • VT has a statutory restriction on maximum out-of-pocket pharmacy costs, but waived that for one bronze plan to bring down cost-sharing. 11 Sources
QUESTIONS? cparcham@familiesusa.org Dedicated to creating a nation where the best health and health care are equally accessible and affordable to all FamiliesUSA.org
Q & A
Stan Dorn Families USA Director of the National Center for Coverage Innovation and Senior Fellow
Affordability in Maryland’s Individual Market Stan Dorn, senior fellow and director of the National Center for Coverage Innovation Maryland Health Benefit Exchange Affordability Work Group April 19, 2019 Dedicated to creating a nation where the best health and health care are equally accessible and affordable to all
I. Presentation overview II. Who has affordability problems? III. What are these problems’ major causes? IV. What policy solutions deserve consideration?
The conventional wisdom about who has trouble affording health care and coverage • People in the individual market are basically OK if they qualify for federal premium tax credits (PTCs). Who are they? o Incomes above Medicaid levels and at or below 400 percent of the federal poverty level (FPL) — roughly $50,000 for an individual and $100,000 for a family of four. o No offer of employer-based insurance (ESI) that the ACA classifies as affordable. o U.S. citizens or lawfully present non-citizens. • The people who are really suffering receive no help at all. They are generally above 400 percent of FPL and must buy insurance on their own. A 60-year old, single adult buys a benchmark plan in Bethesda At 399% FPL At 401% FPL • Monthly income: $4,153 • Monthly income: $4,174 • Consumer cost for • Consumer cost for benchmark plan: $398 benchmark plan: $1,016
The truth is more nuanced People who do People who not qualify for qualify for PTCs PTCs Some experience serious affordability problems, Many experience serious especially those with affordability problems incomes just above 400% FPL The majority of individual- market participants with incomes too high for PTCs face relatively modest affordability challenges 18
• Most individually-insured Maryland residents with incomes too high for PTCs are relatively affluent Individually-insured Maryland Individually-insured Maryland residents above 400% FPL, residents above 400% FPL, income by dollars (2017) income by FPL (2017) $300,000 Between and Under 400 and higher $100,000 500 13.5% 21.9% $200,000 percent to of FPL, $299,999 21.3% 15.4% Above 500 percent $100,000 of FPL, to 78.7% $199,999 49.2% Source: NCCI/Families USA analysis of 2017 American Community Survey (ACS) data 19
Despite PTCs, lower-income Marylanders are more likely to be uninsured Among non-elderly adults in Maryland without employer- sponsored insurance, the percentage who are uninsured, by income: 2017 56% 45% 36% 24% 139-300% FPL 301-400% FPL 401-500% FPL >500% FPL Source: NCCI/Families USA analysis of 2017 ACS data. Note : data display is limited to uninsured consumers and those reporting coverage in the individual market. ACS data do not identify people ineligible for PTCs because of immigration status or ESI offers. ACS respondents sometime 20 mischaracterize their coverage.
Problems with unaffordable bills are most common for the uninsured and for lower-income people The percentage of non-elderly U.S. residents unable to pay medical bills or having trouble paying medical bills, by income and insurance status: 2017 Individually insured Uninsured 30% 24% 21% 15% 13% 13% 8% 8% 125-300% FPL 301-400% FPL 401-500% FPL >500% FPL Source: NCCI/Families USA analysis of 2017 National Health Interview Survey (NHIS) data. ACS data do not identify people ineligible for PTCs because of immigration status or ESI offers. 21
Recommend


More recommend
Explore More Topics
Stay informed with curated content and fresh updates.