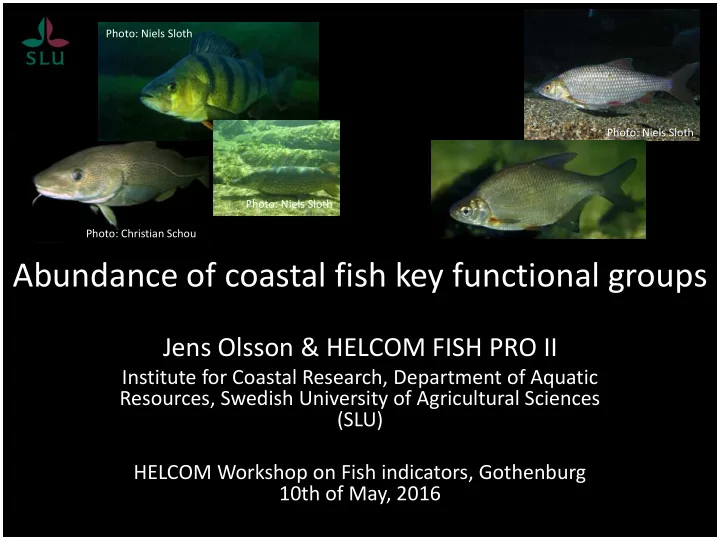

Photo: Niels Sloth Photo: Niels Sloth Photo: Niels Sloth Photo: Christian Schou Abundance of coastal fish key functional groups Jens Olsson & HELCOM FISH PRO II Institute for Coastal Research, Department of Aquatic Resources, Swedish University of Agricultural Sciences (SLU) HELCOM Workshop on Fish indicators, Gothenburg 10th of May, 2016
CONTENT • The indicators • Why coastal fish? • Coastal fish and pressures • Data and storage system • GES-approach and assessment scale • Aggregation and confidence • Current status
THE INDICATORS Relative abundance/biomass of: - Piscivores. Perch, pike, pikeperch, cod and turbot. Species dependent on region. - Cyprinids. Fish from the carp family (roach, breams, bleak etc.), mid trophic level fish. Only applicable in northern and eastern areas of the Baltic - Mesopredators. Mid-trophic level fish species as wrasses, gobies, flounder etc. Southern and western Baltic
WHY KEY COASTAL FISH SPECIES? • Fish integrates processes in the coastal food-web => good indicators of ecosystem state (HELCOM 2006, 2012) • Fish (via top-down processes) influence function and structure of coastal ecosystems (Eriksson et al 2009; Östman et al 2016) • Fish are of great socio-economical importance to small- scaled coastal fisheries and recreational fisheries (HELCOM 2015) • Coastal fish hence included in BSAP, MSFD (D1,3 & 4) and CFP
KEY COASTAL FISH SPECIES AND PRESSURES Plethora of pressures impacting coastal fish communities ” Perch pic ”: Anna Gårdmark
KEY COASTAL FISH SPECIES AND PRESSURES Plethora of pressures impacting coastal fish communities ” Perch pic ”: Anna Gårdmark
DATA TO SUPPORT THE INDICATOR Coastal fish monitoring in various forms Gill net monitoring, commercial catch statistics, coastal trawl surveys, fyke net monitoring and recreational fishermen surveys Still spatial gaps. No data for cyprinids or mesopredators in Germany and Denmark. No data yet for piscivores in Denmark.
DATA STORAGE SYSTEM • Set up of COOL-database at the HELCOM web • Will contain CORE-indicator data and latest status assessment • Financed within the Baltic Boost project
GES-CONCEPT • Coastal fish are local -> Assessment unit level 3 • One assessment per monitoring area (area specific GES-boundaries) - Base-line approach (data > 15 years) - Trend-based approach (data < 15 years) • Reference state could either reflect GES or subGES
GES-CONCEPT - piscivores Base-line approach Trend-based approach NPISC� Full data set 70.00� 60.00� 50.00� 40.00� NPISC� 30.00� 20.00� 10.00� 0.00� 1987�1990�1993�1996�1999�2002�2005�2008�2011� Abundance� of� Piscivores� Assessment Assessment 60.00� Base line period 50.00� 40.00� GES� 30.00� NPISC� 20.00� SUBGES� 10.00� 0.00� 1998� 2001� 2004� 2007� 2010� 2013�
GES-CONCEPT – cyprinids/mesopredators Base-line approach Trend-based approach
AGGREGATION PRINCIPLES ”Majority rule” within assessment units and across monitoring areas GES is observed if > 50% of the monitoring areas within an assessment unit is GES if > 50% of the areas within an assessment unit are GES (or subGES), then the status of the assessment unit = GES (or subGES) if 50% of the areas within an assessment unit are subGES, then the status of the assessment unit = subGES Or the HOLAS II aggregation principle (NEAT-tool) will be applied
CONFIDENCE Three levels of confidence across four criteria All four criteria of confidence must be fulfilled to attain a certain level of confidence
STATUS IN 2013 Cyprinids Piscivores http://www.helcom.fi/baltic-sea-trends/indicators/abundance-of-coastal-fish-key-functional-groups/
Thank you for your attention Questions? FRÅGOR? Jens.Olsson@slu.se Photo: Martin Karlsson Photo: Martin Karlsson
Recommend
More recommend