A Modeling Approach for Storage Workloads Christina Delimitrou 1 , - PowerPoint PPT Presentation
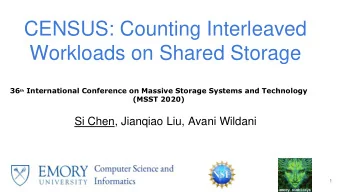
Decoupling Datacenter Studies from Access to Large-Scale Applications: A Modeling Approach for Storage Workloads Christina Delimitrou 1 , Sriram Sankar 2 , Kushagra Vaid 2 , Christos Kozyrakis 1 1 Stanford University, 2 Microsoft IISWC
Decoupling Datacenter Studies from Access to Large-Scale Applications: A Modeling Approach for Storage Workloads Christina Delimitrou 1 , Sriram Sankar 2 , Kushagra Vaid 2 , Christos Kozyrakis 1 1 Stanford University, 2 Microsoft IISWC – November 7 th 2011
Datacenter Workload Studies Open-source approximation of real Statistical models of real applications applications Real apps App App App User on real Behavior data Model center Actual Collect traces, make model App App App apps Run on Model Model Model Real similar HW HW Collect measurements Collect measurements ⁺ Pros: Resembles actual applications ⁺ Pros: Trained on real apps – more ⁺ Pros: Can modify the underlying hardware representative ⁻ Cons: Not exact match to real DC ⁻ Cons: Hardware and Code dependent applications ⁻ Cons: Many parameters/dependencies to model
Datacenter Workload Studies Open-source approximation of real Use statistical models of real applications applications Real apps App App App User on real Behavior data Model center Actual Collect traces, make model App App App apps Run on Model Model Model DC similar HW HW Collect measurements Collect measurements ⁺ Pros: Resembles actual applications ⁺ Pros: Trained on real apps – more ⁺ Pros: Can modify the underlying hardware representative ⁻ Cons: Not exact match to real DC ⁻ Cons: Hardware and Code dependent applications ⁻ Cons: Many parameters/dependencies to model
Outline Introduction Modeling + Generation Framework Validation Decoupling Storage and App Semantics Use Cases SSD Caching • Defragmentation Benefits • Future Work 4
Executive Summary Goal Statistical model for backend tier of DC apps + accurate generation tool Motivation Replaying applications in many storage configurations is impractical DC applications not publicly available Storage system: 20-30% of DC Power/TCO Prior Work Does not capture key workload features (e.g., spatial/temporal locality) 5
Executive Summary Methodology Trace ten real large-scale Microsoft applications Train a statistical model Develop tool that generates I/O requests based on the model Validate framework (model and tool) Use framework for performance/efficiency storage studies Results Less than 5% deviation between original – synthetic workload Detailed application characterization Decoupled storage activity from app semantics Accurate predictions of storage studies performance benefit 6
Model 4K rd Rnd 3.15ms 11.8% Probabilistic State Diagrams: State : Block range on disk(s) Transition : Probability of changing block ranges Stats : rd/wr, rnd/seq, block size, inter-arrival time (Reference: S.Sankar et al. (IISWC 2009)) 7
Hierarchical Model One or Multiple Levels Hierarchical representation User defined level of granularity 8
Comparison with Previous Tools IOMeter: most well-known open-source I/O workload generator DiskSpd: workload generator maintained by the windows server perf team Δ of Features IOMeter DiskSpd Inter-Arrival Times (static or distribution) Intensity Knob Spatial Locality Temporal Locality Granular Detail of I/O Pattern Individual File Accesses* * more in defragmentation use case 9
Implementation (1/3): Inter-arrival times Inter-arrival times ≠ Outstanding I/Os!! Inter-arrival times : Property of the workload Outstanding I/Os : Property of system queues Scaling inter-arrival times of independent requests => more intense workload Previous work relies on outstanding I/Os DiskSpd: Time distributions (fixed, normal, exponential, Poisson, Gamma) Each transition has a thread weight , i.e., a proportion of accesses corresponding to that transition Thread weights are maintained both over short time intervals and across the workload’s run 10
Implementation (2/3): Understanding Hierarchy Levels++ -> Information++ -> Model Complexity++ Propose hierarchical rather than flat model: Choose optimal number of states per level (minimize inter-state transition probabilities) Choose optimal number of levels for each app (< 2% change in IOPS) Spatial locality within states rather than across states Difference in performance between flat and hierarchical model is less than 5% Reduce model complexity by 99% in transition count 11
Implementation 3/3: Intensity Knob Scale inter-arrival times to emulate more intensive workloads Evaluation of faster storage systems, e.g., SSD-based systems Assumptions : Most requests in DC apps come from different users (independent I/Os), so scaling inter-arrival times is the expected behavior in the faster system The application is not retuned for the faster system (spatial locality, I/O features remain constant) – may require reconsideration 12
Methodology Production DC Traces to Storage I/O Models 1. Collect traces from production servers of a real DC deployment I. ETW : Event Tracing for Windows II. Block offset, Block size, Type of I/O I. File name, Number of thread II. … III. Generate the storage workload model with one or multiple levels (XML III. format) Storage I/O Models to Synthetic Storage Workloads 2. Give the state diagram model as an input to DiskSpd to generate the synthetic I. I/O load. Use synthetic workloads for performance, power, cost-optimization studies. II. 13
Experimental Infrastructure Workloads – Original Traces: Messenger , Display Ads , User Content (Windows Live Storage) (SQL-based) • Email , Search and Exchange (online services) • D-Process (distributed computing) • TPCC , TPCE (OLTP workloads) • TPCH (DSS workload) • Trace Collection and Validation Experiments : Server Provisioned for SQL-based applications: 8 cores, 2.26GHz Total storage: 2.3TB HDD SSD Caching and IOMeter vs. DiskSpd Comparison : Server with SSD caches: 12 cores, 2.27GHz Total storage: 3.1TB HDD + 4x8GB SSD 14
Validation Compare statistics from original app to statistics from generated load Models developed using 24h traces and multiple levels Synthetic workloads ran on appropriate disk drives (log I/O to Log drive, SQL queries to H: drive) Metrics Original Workload Synthetic Workload Variation Rd:Wr Ratio 1.8:1 1.8:1 0% Random % 83.67% 82.51% -1.38% Block Size Distr. 8K(87%) 64K (7.4%) 8K (88%) 64K (7.8%) 0.33% Thread Weights T1(19%) T2(11.6%) T1(19%) T2(11.68%) 0%-0.05% Avg. Inter-arrival Time 4.63ms 4.78ms 3.1% Throughput (IOPS) 255.14 263.27 3.1% Mean Latency 8.09ms 8.48ms 4.8% Table: I/O Features – Performance Metrics Comparison for Messenger 15
Validation Compare statistics from original app to statistics from generated load Models developed using 24h traces and multiple levels Synthetic workloads ran on appropriate disk drives (log I/O to Log drive, SQL queries to H: drive) 500 Original Trace Synthetic Trace 450 400 :100 :100 350 300 :100 IOPS 250 200 1 level 3 levels 2 levels 2 levels 3 levels 1 level 150 1 level 2 levels 2 levels 1 level 100 50 0 Messenger Search Email User D-Process Display TPCC TPCE TPCH Exchange Content Ads Synthetic Workload Less than 5% difference in throughput 16
Choosing the Optimal Number of Levels Optimal number of levels : First level after which less than 2% difference in IOPS. 1 level 2 levels 3 levels 4 levels 5 levels 700 600 500 IOPS 400 :100 300 :100 200 :100 100 0 Messenger Search Email User D-Process Display Ads TPCC TPCE TPCH Exchange Content Synthetic Workload 17
Validation Verify the accuracy in storage activity fluctuation 500 Original Workload Synthetic Workload 450 400 Throughput (IOPS) 350 300 250 200 150 100 50 0 Time Less than 5% difference in throughput in most intervals and on average 18
Decoupling Storage Activity from App Semantics Use the model to categorize and characterize storage activity per thread Filter I/O requests per thread and categorize based on: Functionality (Data/Log thread) Intensity (frequent/infrequent requests) Activity fluctuation (constant/high request rate fluctuation) Per Thread Characterization for Messenger Thread Type Functionality Intensity Fluctuation Weight Total Data + Log High High 1.00 Data High High 0.42 Data #0 Data High Low 0.27 Data #1 Data Low High 0.13 Data #2 Data Low Low 0.18 Data #3 Log High Low 5E-3 Log #4 Log Low High 4E-4 Log #5 19
Decoupling Storage Activity from App Semantics Reassemble the workload from the thread types: x 8 Data #0 500 450 Data #1 x 13 400 350 x 33 Data #2 300 250 200 x 45 Data #3 150 100 50 x 17 Log #4 0 x 20 Log #5 Recreate correct mix of threads (types + ratios) -> same storage activity as original application without requiring knowledge on application semantics Decouples storage studies from application semantics 20
Comparison with IOMeter 1/2 Comparison of performance metrics in identical simple tests (no spatial locality) Test Configuration IOMeter (IOPS) DiskSpd (IOPS) 4K Int. Time 10ms Rd Seq 97.99 101.33 16K Int. Time 1ms Rd Seq 949.34 933.69 64K Int. Time 10ms Wr Seq 96.59 95.41 64K Int. Time 10ms Rd Rnd 86.99 84.32 Less than 3.4% difference in throughput in all cases 21
Recommend
More recommend
Explore More Topics
Stay informed with curated content and fresh updates.
