
A Gradient-based Adaptive Learning Framework for Efficient Personal - PowerPoint PPT Presentation
A Gradient-based Adaptive Learning Framework for Efficient Personal Recommendation Yue Ning 1 Yue Shi 2 Liangjie Hong 2 Huzefa Rangwala 3 Naren Ramakrishnan 1 1 Virginia Tech 2 Yahoo Research. Yue Shi is now with Facebook, Liangjie Hong is now with
A Gradient-based Adaptive Learning Framework for Efficient Personal Recommendation Yue Ning 1 Yue Shi 2 Liangjie Hong 2 Huzefa Rangwala 3 Naren Ramakrishnan 1 1 Virginia Tech 2 Yahoo Research. Yue Shi is now with Facebook, Liangjie Hong is now with Etsy. 3 George Mason University August 27, 2017
Outline Introduction Problem Challenges The Proposed Framework Applications Adaptive Logistic Regression Adaptive Gradient Boosting Decision Tree Adaptive Matrix Factorization Experimental Evaluation Datasets & Metrics Comparison Methods Ranking Scores Summary
Challenges in Personalized Recommender Systems ◮ Alleviate “average” experiences for users.
Challenges in Personalized Recommender Systems ◮ Alleviate “average” experiences for users. ◮ Lack of generic empirical frameworks for different models.
Challenges in Personalized Recommender Systems ◮ Alleviate “average” experiences for users. ◮ Lack of generic empirical frameworks for different models. ◮ Distributed model learning and less access of data.
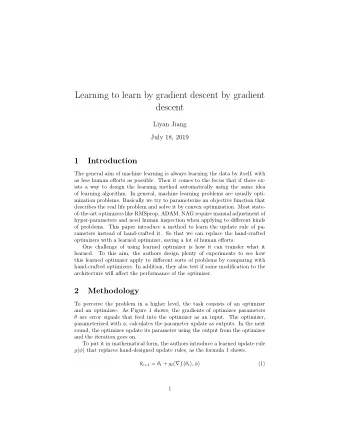
Example of Personal Models 1 1 0.9 0.9 0.8 0.8 Global nDCG score Global MAP score 0.7 0.7 0.6 0.6 0.5 0.5 0.4 0.4 0.3 0.3 0.2 0.2 0.1 0.1 0 0 0 0.1 0.2 0.3 0.4 0.5 0.6 0.7 0.8 0.9 1 0 0.1 0.2 0.3 0.4 0.5 0.6 0.7 0.8 0.9 1 Personal nDCG score Personal MAP score Figure: An example of global and personal models. Left figure showcases the nDCG score of users from global (y-axis) and personal (x-axis) models. (Right: MAP score).
System Framework Input Dataset C 1 C 2 Mapping User Data Global Model: w (0) HashTable t u Userid t u g (1) g (2) g (3) g (t) g (0:tu) Fetch t u Personal Personal Personal Personal Model Model Model Model Figure: System Framework. Component C 1 trains a global model. Component C 2 generates a hashtable based on users’ data distribution. Users request t u from C 2 and C 1 returns a subsequence of gradients g (0: t u ) to users.
Adaptation Mechanism Global update → T � θ ( T ) = θ (0) − η g ( t ) ( θ ) t =1 Local update → t u − 1 T � � θ u = θ (0) − η 1 � g ( t ) ( θ ) − η 2 g ( t ) ( θ u ) t =1 t = t u ◮ θ : the global model parameter. ◮ θ u : the personal model parameter. ◮ u : the index for one user. ◮ t u : the index of global gradients for user u . ◮ g ( t ) ( θ ): global gradients ◮ g ( t ) ( θ u ): personal gradients
How do we decide t u ? ◮ Group users into C groups based on their data sizes in descending order. ◮ Decide the position p u = i C , ◮ C is # groups. ◮ i is the group assignment for user u . ◮ the first group (i=1) of users has the most data. ◮ Set t u = ⌊ T ∗ p u ⌋ ◮ T: total iterations in the global SGD algorithm ◮ Users with the most data have the earliest stop for global gradients.
Adaptive Logistic Regression Objective: min w L ( w ) = f ( w ) + λ r ( w ) (1) ◮ f ( w ) is the negative log-likelihood. ◮ r ( w ) is a regularization function. Adaptation Procedure: ◮ Global update → t u − 1 � = w (0) − η 1 w (0) g ( t ) ( w ) � (2) u t =1 ◮ Local update → T − t u � w ( T ) w (0) g ( t ) ( w u ) � = � − η 2 (3) u u t =1
Adaptive Gradient Boosting Decision Tree Objective: N � L ( t ) = l ( y d , F ( t − 1) + ρ h ( t ) ) + Ω( h ( t ) ) d d N � l ( y d , F (0) + ρ h (0: t ) ) + Ω( h ( t ) ) = (4) d d Adaptation Procedure: = F (0) + ρ h (0: t u ) F (0) � (5) u F ( T ) F (0) + ρ h ( t u : T ) � = � (6) u u u
Adaptive Matrix Factorization Objective: � ( r ui − µ − b u − b i − q T min u p i ) q ∗ , p ∗ , b ∗ u , i + λ ( || q u || 2 + || p i || 2 + b 2 u + b 2 i ) (7) Adaptation Procedure: t u T − t u � � q (0) = q (0) q ( T ) q (0) g ( t ) ( q u ) , � g ( t ) ( � � − η 1 = � − η 2 q u ) (8) u u u u t =0 t =0 t u T − t u � � b (0) = b (0) b ( T ) b (0) � g ( t ) ( b u ) , � = � g ( t ) ( � − η 1 − η 2 b u ) (9) u u u u k =0 t =0
Properties ◮ Generality : The framework is generic to a variety of machine learning models that can be optimized by gradient-based approaches. ◮ Extensibility : The framework is extensible to be used for more sophisticated use cases. ◮ Scalability : In this framework, the training process of a personal model for one user is independent of all the other users.
Datasets Table: Dataset Statistics News Portal # users 54845 # features 351 Movie Ratings # click events 2,378,918 Netflix Movielens # view events 26,916,620 # users 478920 1721 avg # click events per user 43 # items 17766 3331 avg # events per user 534 sparsity 0.00942 0.039 ◮ For LogReg and GBDT: News Portal dataset ◮ For Matrix Factorization: Movie rating datasets (Netflix, Movielens)
Metrics ◮ MAP: Mean Average Precision. ◮ MRR: Mean Reciprocal Rank. ◮ AUC: Area Under (ROC) Curve. ◮ nDCG: Normalized Discounted Cumulative Gain. ◮ RMSE: Root Mean Square Error ◮ MAE: Mean Absolute Error
Comparison Methods Table: Objective functions for different methods. Model LogReg � N d =1 f ( w ) + λ || w || 2 Global 2 � N u j =1 f ( w u ) + λ || w u || 2 Local 2 � N u 2 || w u − w || 2 + λ 2 f ( w u ) + λ 1 2 || w u || 2 MTL j Model GBDT � N d l ( y d , F (0) + ρ h (0: t ) ) + Ω( h ( t ) ) Global d � N u l ( y j , F (0) + ρ h (0: t ) ) + Ω( h ( t ) ) Local j j MTL - Model MF � u p i ) + λ ( || q u || 2 + || p i || 2 + b 2 u , i ( r ui − µ − b u − b i − q T u + b 2 Global i ) � q u || 2 + || � p i || 2 + � i ∈ N u ( r ui − µ − � b u − � u + � q T b 2 b 2 Local b i − � u � p i ) + λ ( || � i ) global+ λ 2 [( q u − q ) 2 + ( p i − p ) 2 + ( b u − A u ) 2 + ( b i − A i ) 2 ] MTL ◮ Global: models are trained on all users’ data ◮ Local: models are learned locally on per user’s data ◮ MTL: users models are averaged by a global parameter.
Ranking Performance - LogReg 0.3 ◮ AUC, MAP, MRR 0.74 Global MTL Global MTL 0.72 Local Adaptive 0.28 AUC score on Test Local Adaptive MAP score on Test 0.7 0.26 0.68 and nDCG scores on 0.24 0.66 0.64 0.22 the test dataset with 0.62 0.2 0.6 0.18 0.58 varying training 0.56 0.16 0 100 200 300 400 500 0 20 40 60 80 100 120 140 160 180 200 epochs epochs. epochs (a) AUC (b) MAP ◮ The proposed adaptive LogReg 0.6 0.6 Global MTL Global MTL 0.55 nDCG score on Test 0.58 Local Adaptive MRR score on Test Local Adaptive 0.5 models achieve higher 0.56 0.45 0.54 0.4 0.52 scores with fewer 0.35 0.3 0.5 0.25 0.48 epochs. 0.2 0.46 0.15 0 20 40 60 80 100 120 140 160 180 200 0 20 40 60 80 100 120 140 160 180 200 ◮ Global models epochs epochs (d) nDCG (c) MRR perform the worst.
Ranking Performance - GBDT Table: Performance comparison based on MAP, MRR, AUC and nDCG for GBDT . Each value is calculated from the average of 10 runs with standard deviation. Global- GBDT #Trees MAP MRR AUC nDCG 20 0.2094(1e-3) 0.3617(2e-3) 0.6290(1e-3) 0.5329(6e-4) 50 0.2137(1e-3) 0.3726(1e-3) 0.6341(1e-3) 0.5372(6e-4) 100 0.2150(8e-3) 0.3769(1e-3) 0.6356(8e-4) 0.5392(6e-4) 200 0.2161(5e-4) 0.3848(1e-3) 0.6412(6e-4) 0.5415(5e-4) Local- GBDT #Trees MAP MRR AUC nDCG 20 0.2262(2e-3) 0.4510(5e-3) 0.6344(3e-3) 0.5604(2e-3) 50 0.2319(2e-3) 0.4446(4e-3) 0.6505(2e-3) 0.5651(2e-3) 100 0.2328(1e-3) 0.4465(5e-3) 0.6558(2e-3) 0.5651(2e-3) 200 0.2322(2e-3) 0.4431(2e-3) 0.6566(1e-3) 0.5649(1e-3) Adaptive- GBDT #Trees MAP MRR AUC nDCG 20+50 0.2343 (2e-3) 0.4474(4e-3) 0.6555(2e-3) 0.5661(2e-3) 50+50 0.2325(2e-3) 0.4472(1e-4) 0.6561(8e-4) 0.5666 (6e-4) 10+100 0.2329(2e-3) 0.4423(3e-3) 0.6587 (1e-3) 0.5650(3e-3)
Ranking Performance - GBDT 0.6 0.15 Group1(GBDT) Group7(GBDT) 0.59 0.14 0.58 0.13 0.57 0.12 Test MAP 0.56 Test MAP 0.11 0.55 0.1 0.54 0.09 0.53 0.08 0.52 0.07 0.51 0.06 0.5 0.05 Global Local Adaptive Global Local Adaptive (a) Group 1 (b) Group 7 Figure: MAP Comparison of Group 1 (least) and Group 7 (most) for GBDT methods. ◮ MAP score for the groups of users with least data (Group 1) and most data (Group 7) for GBDT models. ◮ Adaptive-GBDT outperform both global and local GBDT models in terms of MAP for all groups of users.
Ranking Performance - LogReg vs GBDT 0.7 0.68 Global-GBDT 0.68 0.67 Local-GBDT 0.66 0.66 Adaptive-GBDT AUC score 0.64 AUC score 0.65 0.62 0.64 0.6 0.63 0.58 Global-LogReg Local-LogReg 0.62 0.56 MTL-LogReg 0.61 0.54 Adaptive-LogReg 0.52 0.6 0.2 0.3 0.4 0.5 0.6 0.7 0.8 0.9 1 0.2 0.3 0.4 0.5 0.6 0.7 0.8 0.9 1 % of training samples % of training samples (a) LogReg (b) GBDT ◮ AUC score for Global-GBDT, Local-GBDT, and Adaptive-GBDT with # of training samples from 20% to 100%. ◮ On average of AUC, Adaptive-GBDT performs better than other methods. ◮ With the increase of training samples, GBDT based methods tend to perform better while LogReg methods achieve relatively stable scores.
Recommend


More recommend
Explore More Topics
Stay informed with curated content and fresh updates.