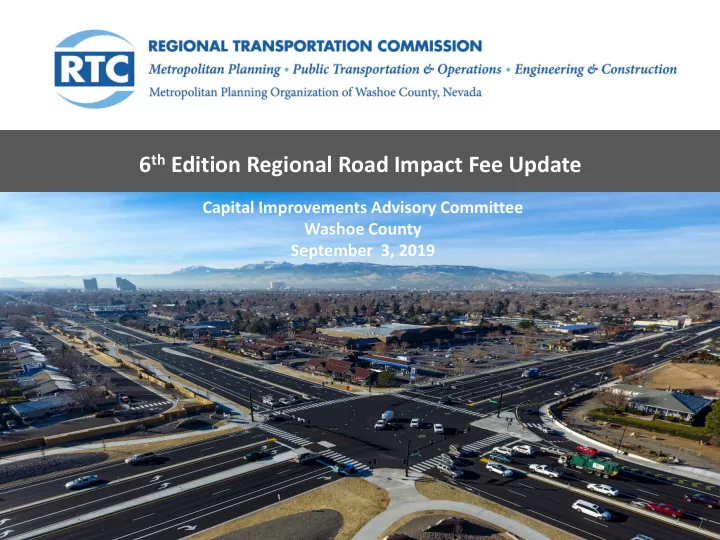

6 th Edition Regional Road Impact Fee Update Capital Improvements Advisory Committee Washoe County September 3, 2019
What is the Regional Road Impact Fee Program? Impact Fees Regional Road New Development Capacity Improvements
NRS 278B – Impact Fee Statute 278B.150 - Capital Improvements Advisory Committee: Duties Land Use Assumptions Capital Improvement Plan Impact Fees RRIF General Administrative Manual
Regional Road Impact Fee Development Long Range Plan 10 Year Plan RRIF Capital Consensus Regional RTC Travel Improvement Forecast Transportation Demand Plan by (Population & Model Plan Service Area Employment) TMRPA Land Development Model New Trips on Reno, Sparks, Developer the Regional & Washoe share of Road County RRIF CIP Costs Network ($) Master Plans (VMT) Calculate RRIF Rate by Growth Cost Service Area ($/VMT) RRIF Fee Schedule by Land Use
Example of a Development Area Service Units Based on Land Use Measured in Vehicle Miles Travelled (VMT)
Regional Transportation Plan Region-Wide Long Term Transportation Investments
Regional Road Impact Fee Capital Improvement Plan 10 Year Regional Road Improvements Stonebrook Stonebrook Lemmon Dr Lemmon Dr Wngfield Sun Valley Sun Valley Hills McCarran McCarran McCarran Wells Oddie Loop Keystone Plumb 2017-2021 2022-2026
North and South Service Areas Defined by Area Plan Boundaries and Separated by I-80
6 th Edition Impact Fee Rates North Service South Service Description Area Area 1 st 10 Years Capacity Related RTP projects $427,729,055 $301,352,036 Other Funding Sources ($324,445,934) ($228,584,992) RRIF Share by Service Area $103,283,121 $72,767,044 VMT Growth by Service Area 322,046 232,352 $/VMT for RRIF Share $320.71 $313.18 RRIF Share ($) / VMT Growth = $/VMT Rate
Proposed 6 th Edition and Current 5 th Edition RRIF Fees Comparison Draft 6th Edition 5th Edition Year 3 Indexing RRIF Input Variables North South North South Average Trip Length (Mi) 2.79 2.64 2.87 2.82 RRIF Share of CIP $103,283,121 $72,767,044 $65,394,800 $100,474,800 Difference VMT Growth 322,046 232,352 258,081 350,027 6 th vs 5 th Ed RRIF Cost per VMT $320.71 $313.18 $267.58 $303.11 $53.13 $10.07 6th Ed 6th Ed 5th Ed 5th Ed VMT VMT VMT VMT Development Type Unit Size RRIF RRIF RRIF RRIF North South North South North South North South North South Single Family Dwelling 15.03 $4,820 14.22 $4,453 14.93 $3,995 14.67 $4,447 $825 $7 Multi Family Dwelling 10.23 $3,281 9.68 $3,032 9.70 $2,596 9.53 $2,889 $685 $143 Retail & Restaurants 1000 SF 22.94 $7,357 21.71 $6,799 26.69 $7,142 26.23 $7,951 $215 $1,151 Warehouse 1000 SF 1.77 $568 1.68 $526 3.73 $998 3.66 $1,109 $430 $583
RRIF General Administrative Manual IX. Exemptions – State Buildings X. Impact Fee Offset Agreements Timing
Roadway Improvements 1996-2019 Regional Road Capacity Improvements through the RRIF Program $ 204 M Developer Built $ 99 M RTC Built RRIF Revenue $ 303 M Capacity Improvements Capacity Relief Projects 1996 - 2019 12
5 th Edition RRIF Capital Improvement Plan Complete Southeast Connector (Veterans Pkwy) 4 th /Prater BRT McCarran/North Virginia Intersection Pyramid/McCarran Intersection Sutro Multimodal Kietzke Ln Multimodal SE McCarran Widening Underway Virginia BRT Keystone Multimodal Oddie/Wells Multimodal Sparks Blvd Widening Plumb Ln Multimodal Mill St/Terminal Multimodal Future Geiger Grade Widening Mill St Extension Pembroke Widening
Questions? Julie Masterpool, P.E. RTC RRIF Program Manager jmasterpool@rtcwashoe.com Dwayne Smith, P.E. Division Director of Engineering/Capital Projects desmith@washoecounty.us Mitch Fink, EIT Washoe RRIF Administrator/Engineer Manager mfink@washoecounty.us 14
Recommend
More recommend