4/26/2016 DISCLOSURES DEVELOPMENT OF A PHARMACIST DRIVEN - PDF document
4/26/2016 DISCLOSURES DEVELOPMENT OF A PHARMACIST DRIVEN MEDICATION REVIEW PROCESS TO ADDRESS IRB Status: Exempt POLYPHARMACY WITHIN A NEUROLOGY CLINIC Co-investigators: Kristal Barker, PharmD Betsy Biggerstaff, PharmD Lindsey
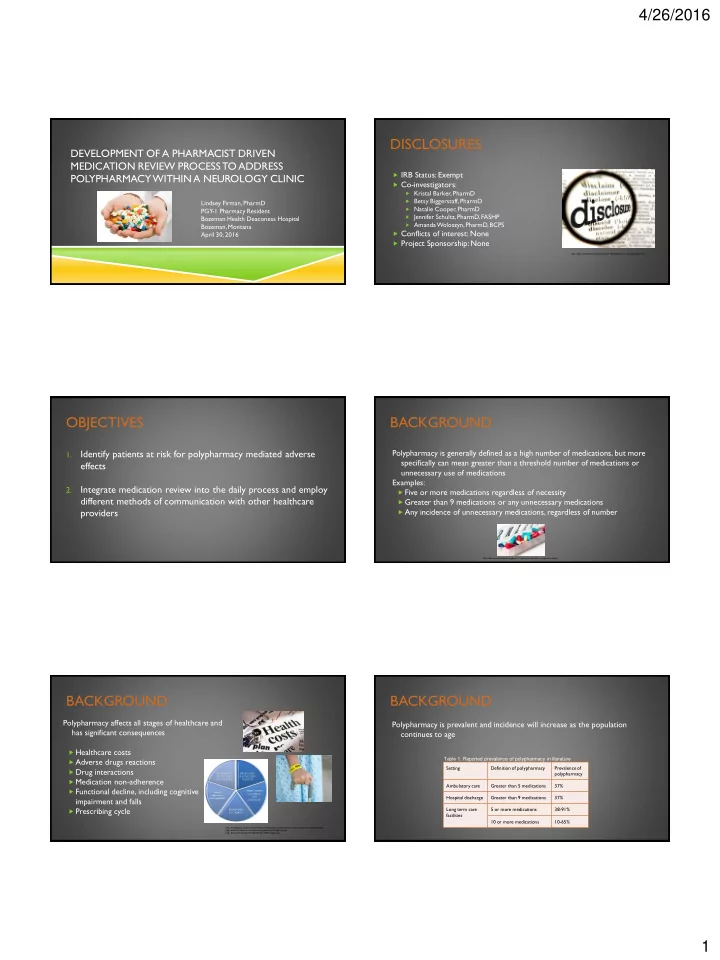
4/26/2016 DISCLOSURES DEVELOPMENT OF A PHARMACIST DRIVEN MEDICATION REVIEW PROCESS TO ADDRESS IRB Status: Exempt POLYPHARMACY WITHIN A NEUROLOGY CLINIC Co-investigators: Kristal Barker, PharmD Betsy Biggerstaff, PharmD Lindsey Firman, PharmD Natalie Cooper, PharmD PGY-1 Pharmacy Resident Jennifer Schultz, PharmD, FASHP Bozeman Health Deaconess Hospital Amanda Woloszyn, PharmD, BCPS Bozeman, Montana Conflicts of interest: None April 30, 2016 Project Sponsorship: None http://www.criticalmassachusetts.com/2011/06/disclosure-is-no-substitute-for.html OBJECTIVES BACKGROUND Identify patients at risk for polypharmacy mediated adverse Polypharmacy is generally defined as a high number of medications, but more 1. specifically can mean greater than a threshold number of medications or effects unnecessary use of medications Examples: Integrate medication review into the daily process and employ 2. Five or more medications regardless of necessity different methods of communication with other healthcare Greater than 9 medications or any unnecessary medications providers Any incidence of unnecessary medications, regardless of number http://www.champ-program.org/page/101/geriatric-medication-management-toolkit BACKGROUND BACKGROUND Polypharmacy affects all stages of healthcare and Polypharmacy is prevalent and incidence will increase as the population has significant consequences continues to age Healthcare costs Adverse drugs reactions Table 1. Reported prevalence of polypharmacy in literature Setting Definition of polypharmacy Prevalence of Drug interactions polypharmacy Medication non-adherence Ambulatory care Greater than 5 medications 37% Functional decline, including cognitive Hospital discharge Greater than 9 medications 37% impairment and falls Prescribing cycle Long term care 5 or more medications 38-91% facilities 10 or more medications 10-65% http://thinkprogress.org/health/2012/10/22/1062441/how-rising-health-care-costs-impact-the-national-budget/ http://www.firstaidforfree.com/wp-content/uploads/2015/09/Falls.jpg http://drwills.com/wp-content/uploads/2015/05/drugcycle.jpg 1
4/26/2016 BACKGROUND AND OBJECTIVE METHODS- CHART REVIEW PHASE 1. 50 randomly selected patients of Bozeman Health Neuroscience Center Interdisciplinary teams have addressed polypharmacy in various 2. Diagnosis of Parkinson’s disease, Alzheimer’s disease, dementia or other memory loss settings 3. The data gathered included: g. Number of medications in the following categories: a. Age 1. Meeting Beer’s list criteria Neurology clinic is an ideal setting for review as side effects b. Sex c. Primary diagnosis 2. Meeting START criteria can have a significant impact on this patient population d. Number of comorbidities 3. Drug interactions category D or X e. Creatinine clearance 4. Dose adjustments needed f. Potential interventions 5. No indication Objective: Develop a process for identifying high risk 6. Monitoring needed http://www2.comtecmed.com/img/uploads/files/backgrounds/controversies_ polypharmacy patients and communicating potential inner/contrevercis_inner_pictures_18.jpg 7. Therapeutic duplication 8. Inappropriate OTCs interventions to providers 9. Potential adverse reactions http://www.bcmj.org/sites/default/files/md2b-bleackley-chart-reviews- photo.jpg DATA AND RESULTS- CHART REVIEW METHODS-ACTIVE INTERVENTION PHASE Table 3. Chart review results Weekly review of upcoming appointments in the neurology clinic Medication Regimen Data Mean Range Table 2. Patient characteristics Graph 1. Data By Age Group Patient Characteristics n=50 (%) Medications 9.3 1-17 12 Mean Number of Vitamins or Herbals 1.7 0-10 10 Comorbidities Male 21 (42%) Medications meeting 1.6 0-5 Mean Number 8 Over 65 years of age 40 (80%) Beer’s List criteria Mean Number of 6 Medications Parkinson’s Diagnosis 27 (54%) Medications meeting 1.4 0-5 4 STOPP criteria Alzheimer’s or 23 (46%) Mean Number of Dementia Diagnosis 2 Potential Medications that meet 0.3 0-2 Interventions 0 START criteria Greater than 4 23 (46%) <65 65-74 75-85 >85 comorbidities Age Group Drug interactions rating D 1.8 0-9 or higher Greater than 5 31 (62%) medications Potential Interventions 1.9 0-4 Figure 1. Screen shot of provider schedule with medication list METHODS- ACTIVE INTERVENTION METHODS-ACTIVE INTERVENTION PHASE PHASE Identified patients with extensive Extensive drug lists drug lists, high risk medications, Generally looking at patients who had long medication lists and certain high risk disease Included blatant drug interactions that were found on brief review states for further review High risk medications Benzodiazepines Anticholinergics Emailed provider with Sleeps aids, including z-drugs and diphenhydramine recommendations or clarifications Opioids as appropriate based on review High risk disease states- for sensitivity to side effects or difficulty in treating Parkinson’s disease Alzheimer’s disease Data was collected similar to the Peripheral neuropathy chart review, with an emphasis on intervention outcomes Figure 2. Example medication list and interventions 2
4/26/2016 DATA AND RESULTS- ACTIVE DATA AND RESULTS- ACTIVE INTERVENTION PHASE INTERVENTION PHASE What constitutes a successful intervention? Table 5. Results of intervention phase Table 4. Patient characteristics during intervention phase Medication Regimen Data Mean Range 39 interventions on a Patient Characteristics n=29 (%) Medications 15.3 8-27 total of 29 patients- average of 1.3 accepted Male 11 (38%) Vitamins or Herbals 2.8 0-8 interventions per patient Over 65 years of age 16 (55%) Drug interactions rating D 5.4 0-18 88 potential interventions or higher Parkinson’s, Alzheimer’s, 13 (45%) to attempt led to 39 or Dementia Diagnoses interventions- 41% Potential Interventions 3.2 0-6 success rate Greater than 9 28 (97%) Interventions to attempt 3.0 0-6 medications Successful interventions 1.3 0-3 DATA AND RESULTS- ACTIVE DATA AND RESULTS- COMPARISON INTERVENTION PHASE Graph 2. Comparison of Chart Review Random selection of patients with and Active Intervention Phase Findings What constitutes a successful intervention? specific diagnoses 18 versus 15.3 16 Any action on or change to a patient’s chart or medication list that follows 14 Deliberate selection of patients with Mean Number 12 a given recommendation high numbers of medications and 9.3 10 8 varying diagnoses 5.4 6 2.8 3.3 4 1.7 1.8 1.9 2 0 Number of Number of Number of Potential Mean age was 73 during chart review medications vitamins/herbals interactions Interventions category D or X and 63 during active intervention Findings phase Chart Review Active Intervention Phase DISCUSSION DISCUSSION Polypharmacy was clearly present in patients of the neurology clinic On further review, only 18 of the 29 patients had successful interventions- Rates were higher than that generally reported in literature- providing an average rate of 2.1 interventions per patient if any were 62% in chart review phase had nine or more medications accepted Could be attributed to higher risk population The mean number of potential interventions increased from 1.9 to 3.2 when population was selected based on high number of medications There was a 42% success rate on attempted interventions 3
4/26/2016 DISCUSSION DISCUSSION On further review, only 18 of the 29 patients had successful interventions- On patients where the provider was able to address the interventions, providing an average rate of 2.1 interventions per patient if any were interventions were more likely to be successfully made accepted Communication is KEY!! DISCUSSION DISCUSSION On patients where the provider was able to address the interventions, On patients where the provider was able to address the interventions, interventions were more likely to be successfully made. interventions were more likely to be successfully made. Why wouldn’t the provider be able to make the interventions? Why wouldn’t the provider be able to make the interventions? Certain visit types do not allow time for medication discussion 1. Example: Procedure visits for Botox injections or electromyography (EMG) DISCUSSION LIMITATIONS Methods changed between phases On patients where the provider was able to address the interventions, interventions were more likely to be successfully made. Communication with neurologist Why wouldn’t the provider be able to make the interventions? Time consuming work up of patients Certain visit types do not allow time for medication discussion 1. Example: Procedure visits for Botox injections or electromyography (EMG) Primary care versus specialty care Provider forgets to bring the printed medication list and interventions 2. Especially common if notification was sent too many days before the appointment and was lost in an email inbox or if provider was seeing multiple patients without returning to his office in between 4
Recommend
More recommend
Explore More Topics
Stay informed with curated content and fresh updates.


