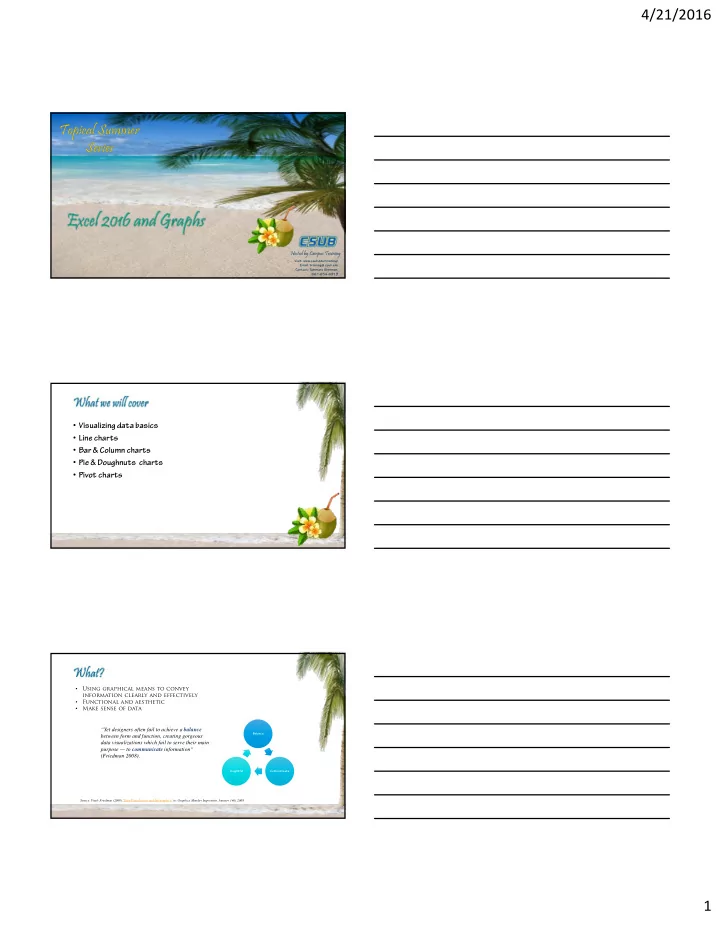

4/21/2016 Hosted by Campus Training Visit: www.csub.edu/training/ Email: training@ csub.edu Contact: Tammara Sherman, 661-654-6919 • Visualizing data basics • Line charts • Bar & Column charts • Pie & Doughnuts charts • Pivot charts Using graphical means to convey • information clearly and effectively Functional and aesthetic • Make sense of data • “Yet designers often fail to achieve a balance Balance between form and function, creating gorgeous data visualizations which fail to serve their main purpose — to communicate information“ (Friedman 2008). Insightful Communicate Source: Vitaly Friedman (2008) "Data Visualization and Infographics" in: Graphics, Monday Inspiration, January 14th, 2008. 1
4/21/2016 “A picture is worth a thousand words.” “The eye is exquisitely sensitive to patterns in variations in color, shape and pattern.” (David McCandless, 2010 TED Talk) The Value of Visualization Should it be a bar, column, or pie chart? How can I make it be What am I visualizing, more meaningful? trends over time, numbers of things, or distributions of things? What do I really want to see? 2
4/21/2016 Training Attendees 600 503 Use when 2 or more items • 500 Show trends over time • 400 Visual comparison • 300 216 192 200 150 150 115 75 72 100 58 50 35 20 0 2012 2013 2014 2015 FDW Office ProCard 7 Values Counts • Sums • Products • Scale Legend • Counts Series 1 Name • Dollars • Series 2 Name • Categories Time, Things, Terms, etc • SAT/ACT Scores 700 588 600 Use when 3 or more items • Show trends over time • 486 484 500 453 Visual comparison • 400 300 200 100 0 SAT ACT Male Female 9 3
4/21/2016 Values Counts • • Sums Products • Scale Legend Counts • • Series 1 Name Dollars • Series 2 Name • Series Series 1 2 Categories Time, Things, Terms, etc • Curre Cu rrent E Educator R ator Role le Teacher 12 Teacher-Leader 2 Education Administrator 2 Intended Career/Position Preschool Teacher* 1 Curriculum Developer 1 Principal Teacher-Leader 0 2 4 Education Administrator 6 8 10 12 14 Teacher Curriculum Developer • Use when 3 or more items Early Childhood Director* Teach college* • Show trends over time 0 1 • Visual comparison 2 3 4 • Works well with long names • Same as column charts (horizontal) 11 Scale Counts • Dollars • Series 1 Values • Counts Sums • Categories Products • Time, Things, Terms, etc • Legend Series 2 Series 1 Name • Series 2 Name • 4
4/21/2016 • Use when you have 2 or more items • Shows proportionality Of the students 12.3 participated % under 28 21% 48-66 42% Of the respondents were 29-47 Female 37% 68% Age 13 Values Scale • Counts Percent • Sums • Products • Legend • Series 1 Name Series 2 Name • Series Series Series Series 1 1 2 2 Categories Time, Things, Terms, etc • % Values Counts • • Sums Products • Scale % • Legend • Series 1 Name Series 1, Series 2 Name • Series 2, 50 50 Categories Time, Things, Terms, etc • 5
4/21/2016 Go to: 1. Open Windows Explorer or My Documents 2. Navigate to: Facshare (s:)//tsherman/E2016O • Excel 2016 and Graphs 3. Copy to your desktop • Excel and Graphs Data.xlsx Grades Counts A 100 B 250 C 150 6
4/21/2016 Fiscal Business Unit Period Accounting Date Acct Cat Account Fdescr Amount Year BKCMP - CSU Bakersfield 2015 208/25/2015 604 604001 - Telephone Usage 5.95 Columns and Values • BKCMP - CSU Bakersfield 2015 208/31/2015 604 604001 - Telephone Usage 9.94 Values are Text or Numbers • BKCMP - CSU Bakersfield 2015 309/29/2015 604 604001 - Telephone Usage 4.82 BKCMP - CSU Bakersfield 2015 410/13/2015 604 604001 - Telephone Usage 10.89 BKCMP - CSU Bakersfield 2015 511/19/2015 604 604001 - Telephone Usage 13.25 Column 1 Column 2 BKCMP - CSU Bakersfield 2015 612/31/2015 604 604001 - Telephone Usage 17.24 BKCMP - CSU Bakersfield 2015 701/19/2016 604 604001 - Telephone Usage 12.44 Value Value BKCMP - CSU Bakersfield 2015 802/12/2016 604 604001 - Telephone Usage 10.42 BKCMP - CSU Bakersfield 2015 701/13/2016 606 606001 - Travel-In State 270.83 BKCMP - CSU Bakersfield 2015 107/16/2015 660 660002 - Printing 1.92 GCF LearnFree.org Provides great step-by-step instructions and videos from basic to advanced users. Numerous resources for Excel 2016 are Lesson 23: Charts available on the web. GCFLearnFree.org YouTube Provides great videos from basic to advanced users. Search Engines Provides great videos, YouTube forums, and instructions from basic to advanced users. Google Search • Visualizing data basics • Line charts • Bar & Column charts • Pie & Doughnuts charts • Pivot charts 7
Recommend
More recommend