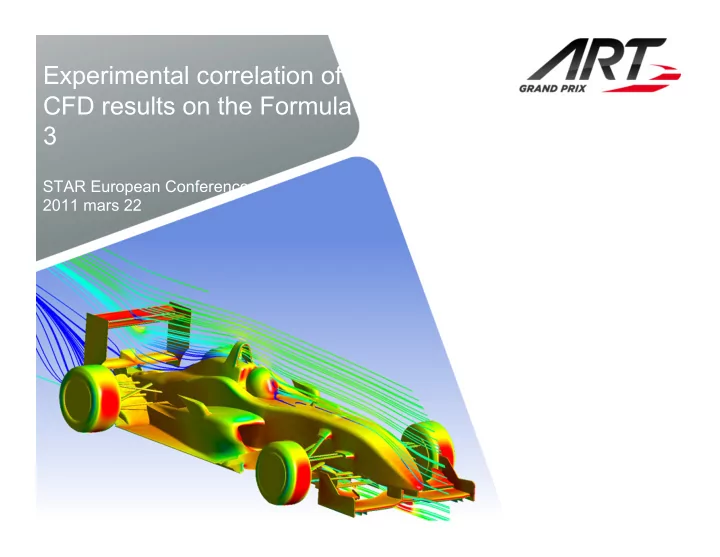

Experimental correlation of CFD results on the Formula 3 STAR European Conference 2011 mars 22
ART Grand Prix Presentation • Junior Formulae Racing Team • Around 35 persons (Racing Team + Development) • Involved in Formula 3, GP3, GP2 • 6 times F3 Euroseries Champion, 3 times GP2 Champion, 1 st GP3 Champion • Vettel, Hamilton, Rosberg, Sutil, Kobayashi, Hulkenberg • F3 positioning within Motorsport categories • Go Kart FR2.0 F3/GP3 GP2 F1 STAR European Conference 2011 2
Aerodynamics Background • Wind tunnel testing • Full scale wind tunnel from 2004 to 2007 • Model scale wind tunnel from 2008 • 375k € invested in wind tunnel testing • CFD simulations 2004 • Externalised CFD in 2008 2008 • Internalised CFD since 2009 2010 • Work with STAR-CCM+ since mid of Jan 2011 STAR European Conference 2011 3
Aim & Objectives • Obtaining an accurate F3 CFD model in order to perform efficient aerodynamic developments • Use of experimental wind tunnel results • Mesh and Model fine tuning • Correlation between CFD and experimental results over several configurations STAR European Conference 2011 4
Experimental testing description • Mercedes GP Petronas F1 Team wind tunnel • State of the art wind tunnel • Moving belt, boundary layer suction • Wheels lift and drag measurement • Air conditioned testing room • Testing specifications • 45% scale model • 40 m.s -1 • Tolerance of measurement : • ±0.001 X ± 0.003 in Z STAR European Conference 2011 5
CFD model highlights • Straight cases :Half car • Meshing • Wrapper + Hexahedral Trimmer + Prism Layer mesh • Fine wake refinements • About 60 M cells • Physics • Steady state cases • RANS SST k- w turbulence model • Porous region for radiators • Velocity specifications on Ground and Wheels STAR European Conference 2011 6
CFD Baseline post-processing • Pressure contours on/under car STAR European Conference 2011 7
CFD Baseline post-processing • Velocity Y-section STAR European Conference 2011 8
CFD Baseline post-processing • Wake Iso-Cp Tot STAR European Conference 2011 9
Correlation study presentation • Simple Correlation based on “sure” data: • Front Wing correlation Rear Wing correlation • 24°/27°/30° 12°/16°/20° • Rear ride height correlation • Rotation around rear wheel axle STAR European Conference 2011 10
Correlation study results • Rear Wing configurations STAR European Conference 2011 11
Correlation study results • Front Wing configurations STAR European Conference 2011 11
Correlation study results • Rear ride height configurations STAR European Conference 2011 11
Timetable • Mid Jan 2011 • Started with Star CCM+ from a surface mesh • End Jan 2011 • First mesh created • End Feb 2011 • Satisfactory simulation convergence • March 2011 • Start of correlation study STAR European Conference 2011 12
Computational resources • 2 Intel Xeon 6 cores @ 3.47Ghz 64Go RAM • Meshing Time : 3h00 • 4 Intel Xeon 4 cores @ 3.06Ghz 48Go RAM • Calculation Time : 70 it/h STAR European Conference 2011 12
Conclusion • Results are generally quite good, achieved in 2 months (close to tolerance of measurement in wind tunnel in most of the case) • Absolute errors good in downforce (less than 5%) but still far in drag (more than 20%). • Relative offsets in drag seem to be interesting • Correlation with experimental results show that our model still need to be improved. STAR European Conference 2011 13
Acknowledgments Questions • Many thanks to Mr. Fauchier, Mr. Thomas, Mr. Dufournet for CD-Adapco for their efficient support • Thanks for your attention • Any questions? STAR European Conference 2011 14
Recommend
More recommend