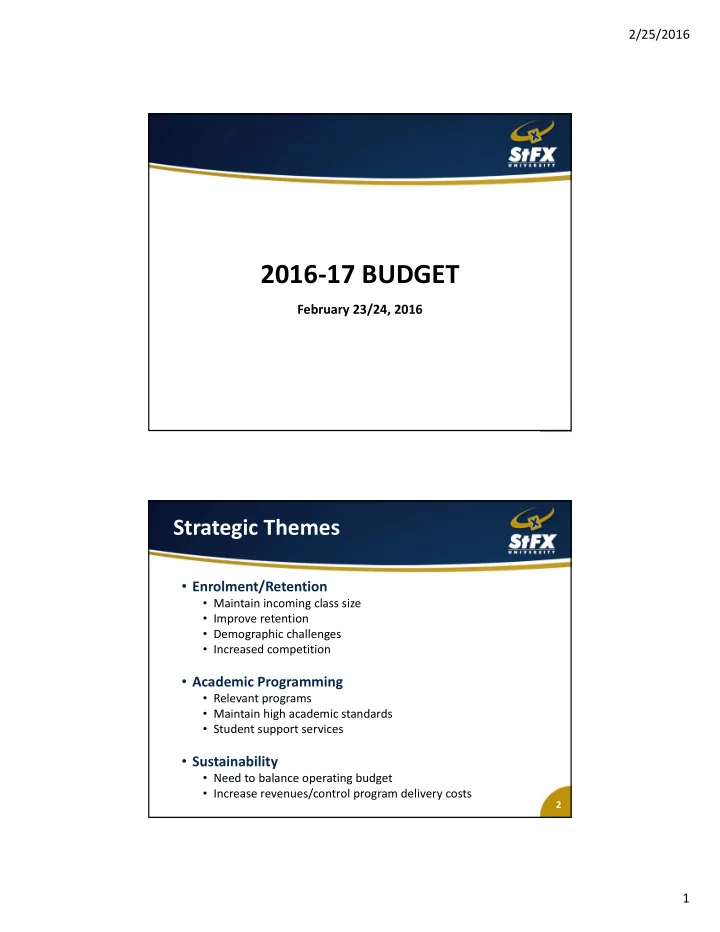

2/25/2016 2016 ‐ 17 BUDGET February 23/24, 2016 Strategic Themes • Enrolment/Retention • Maintain incoming class size • Improve retention • Demographic challenges • Increased competition • Academic Programming • Relevant programs • Maintain high academic standards • Student support services • Sustainability • Need to balance operating budget • Increase revenues/control program delivery costs 2 1
2/25/2016 2016 ‐ 17 BUDGET ST. FRANCIS XAVIER UNIVERSITY 2016 ‐ 17 OPERATING BUDGET Compared to Compared to BUDGET Projection BUDGET Budget Projection FY 15/16 FY 15/16 FY 16/17 FY 2015 ‐ 16 FY 2015 ‐ 16 GOVERNMENT GRANTS 32,241,300 32,193,611 32,482,300 241,000 288,689 TUITION & FEES 35,939,100 36,423,000 39,074,600 3,135,500 2,651,600 ENDOWMENT & OTHER 4,512,000 4,564,000 4,789,500 277,500 225,500 TOTAL OPERATING REVENUE 72,692,400 73,180,611 76,346,400 3,654,000 3,165,789 ACADEMIC 44,341,600 44,411,000 44,270,500 (71,100) (140,500) STUDENT SERVICES 8,229,100 8,913,000 9,612,000 1,382,900 699,000 ADVANCEMENT 2,165,600 2,042,000 2,274,000 108,400 232,000 FINANCE & ADMINISTRATION 17,422,652 17,649,804 18,505,599 1,082,948 855,796 RESTRICTED/NON ‐ DISCRETIONARY 2,650,948 2,476,196 2,749,000 98,052 272,804 TOTAL OPERATING EXPENDITURES 74,809,900 75,492,000 77,411,100 2,601,201 1,919,101 NET OPERATING SURPLUS (DEFICIT) (2,117,500) (2,311,389) (1,064,700) ANCILLARY SURPLUS (DEFICIT) 143,000 300,900 328,000 CONSOLIDATED SURPLUS (DEFICIT) (1,974,500) (2,010,489) (736,700) 3 REVENUE • Provincial funding increased by 1%. • Student Fees: • Tuition Fees be increased by 6%. • Enrolment will increase by 105 domestic students and 20 international students. • Endowment & Other: • Increase of $240,000 due to increase in donations. • One time unrestricted endowment income of $300,000 to partially off ‐ set start ‐ up costs associated with the Energy Management Program. • “Other” revenue has decreased by $300,000 as withdrawals from surpluses in Employee Benefits Program are no longer available. Government funding of $114,000 added associated with Students with Disabilities Program. 4 2
2/25/2016 Academic • Early Retirement Incentive Program: • 21 people taking the retirement incentive. (includes 2 Coady employees) • Annual savings as a result of the program are approximately $1.5 million. • For 2016 ‐ 17 there is a one ‐ time cost of $500,000 for salaries of retiring individuals as the date of their retirement is July 1, 2016. • One ‐ time cost associated with the ERIP payouts is approximately $4 million. • 13 replacements (2 Tenure Track, 5 multi ‐ year limited term, 4 9 month limited term and 2 lab instructors) • Library acquisitions budget increased by $260,000 5 Student Services Budget Increase $1,382,900 16.8% Scholarships 813,000 Students with disabilities 115,100 Net Operational Increase $ 454,900 5.5% • Increased investments in Health & Counselling, student advisor functions, recruitment 6 3
2/25/2016 Advancement • Development costs up $30,000 (net of reallocation of costs from VPs budget) • Alumni costs up $47,000 • Communications costs up $21,000 7 Finance & Admin Facilities Management Budget Increase $484,548 5% Revenue offset 300,000 Net Operational Increase $184,548 1.9% • start ‐ up costs associated with the Energy Management program. 8 4
2/25/2016 Finance & Admin IT Services Budget increase $324,000 11.5% Project Funding 104,000 Savings 90,000 Net Operational Increase $130,000 4.6% • Impact of US Exchange and rising costs associated with maintenance/licensing contract costs 9 Finance & Admin Administration and General • Increase of $274,400 or 5.69% • Short ‐ term sick leave coverage ‐ $50,000 • Travel costs ‐ $35,000 • Increase in payroll processing costs ‐ $40,000 • Salary costs – $55,000 • Other ‐ $58,000 10 5
2/25/2016 Ancillary Services ST. FRANCIS XAVIER UNIVERSITY Ancillary Budget Draft by Function - 2016-17 DETAIL DRAFT Compared to Compared to BUDGET PROJECTION BUDGET Budget Forecast FY 15/16 FY 15/16 FY 16/17 FY 2015 ‐ 16 FY 2015 ‐ 16 Residence $ 122,800 $ 350,000 $ 184,000 $ 61,200 $ (166,000) Food Service 747,900 827,000 784,000 36,100 (43,000) Campus Store 221,700 88,700 289,000 67,300 200,300 Keating Centre (673,800) (705,100) (688,000) (14,200) 17,100 Fitness and Recreation (62,000) (42,800) (96,000) (34,000) (53,200) Conference Services 77,000 86,100 114,000 37,000 27,900 Administration (182,300) (171,000) (171,000) 11,300 ‐ Other Ancillary Services (Bus, Liquor Services) (108,300) (132,000) (88,000) 20,300 44,000 TOTAL REVENUE $ 143,000 $ 300,900 $ 328,000 $ 185,000 $ 27,100 11 MULTI ‐ YEAR OUTLOOK 2015 ‐ 16 2016 ‐ 17 2017 ‐ 18 2018 ‐ 19 2019 ‐ 20 Budget Projection Budget Target Target Target GOVERNMENT GRANTS 32,241,300 32,194,000 32,482,300 32,780,000 33,076,000 33,375,000 TUITION & FEES 35,939,100 36,423,000 39,074,600 42,809,000 46,848,000 48,231,000 ENDOWMENT & OTHER 4,512,000 4,564,000 4,789,500 4,666,000 4,347,000 4,513,000 TOTAL ORDINARY REVENUE 72,692,400 73,181,000 76,346,400 80,255,000 84,271,000 86,119,000 ACADEMIC 44,341,600 44,411,000 44,270,500 45,227,000 45,770,000 47,434,000 STUDENT SERVICES 8,229,100 8,913,000 9,612,000 10,055,000 10,285,000 10,521,000 ADVANCEMENT 2,165,600 2,042,000 2,274,000 2,336,000 2,400,000 2,467,000 FINANCE AND ADMINISTRATION 17,422,652 17,650,000 18,505,600 18,769,000 20,549,000 21,056,000 RESTRICTED & NON ‐ DISCRETIONARY 2,650,948 2,476,000 2,749,000 3,837,500 3,966,000 3,995,000 TOTAL EXPENDITURES 74,809,900 75,492,000 77,411,100 80,224,500 82,970,000 85,473,000 NET OPERATING SURPLUS (DEFICIT) (2,117,500) (2,311,000) (1,064,700) 30,500 1,301,000 646,000 ANCILLARY SURPLUS (DEFICIT) 143,000 300,900 328,000 350,000 375,000 400,000 CONSOLIDATED SURPLUS (DEFICIT) (1,974,500) (2,010,100) (736,700) 380,500 1,676,000 1,046,000 12 6
2/25/2016 LONG ‐ TERM FINANCIAL OUTLOOK Provincial Review Actual/Projected Surplus (Deficit) Surplus/Deficit Annual Cumulative Annual Cumulative 2009 ‐ 10 (1,485) (1,448) (1,485) (1,448) 2010 ‐ 11 83 (1,365) 83 (1,365) 2011 ‐ 12 (500) (1,865) (500) (1,865) 2012 ‐ 13 (4,505) (6,370) (4,505) (6,370) 2013 ‐ 14 (1,165) (7,535) (1,165) (7,535) 2014 ‐ 15 (2,650) (10,185) (616) (8,151) 2015 ‐ 16 (4,168) (14,353) (6,400) (14,551) 2016 ‐ 17 (5,301) (19,654) (750) (15,301) 2017 ‐ 18 (6,086) (25,740) 400 (14,901) 2018 ‐ 19 (6,560) (32,300) 1,700 (13,201) 2019 ‐ 20 1,050 (12,151) 13 CAPITAL PROJECTS UPDATE • Mount Saint Bernard • Nicholson Hall Project • Energy Management Projects • Phase I • Phase II • Lane Parking Lot 14 7
2/25/2016 QUESTIONS? 8
Recommend
More recommend