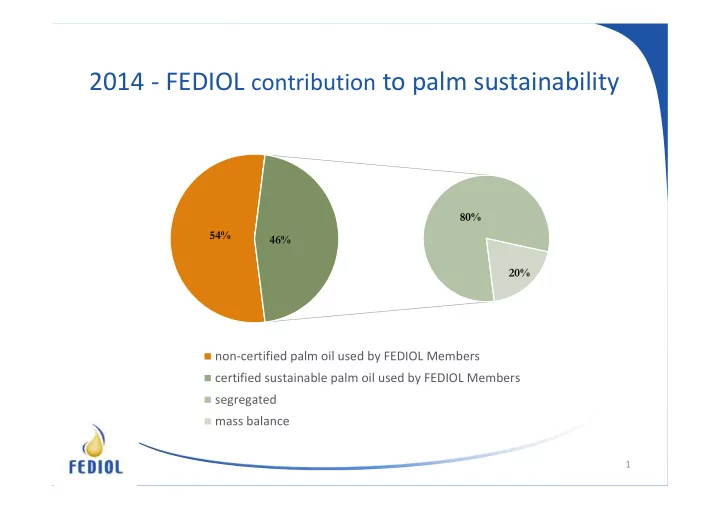

2014 - FEDIOL contribution to palm sustainability 80% 54% 46% 20% non-certified palm oil used by FEDIOL Members certified sustainable palm oil used by FEDIOL Members segregated mass balance 1
Up-wards trend for both sustainable palm oil and palm kernel oil Sustainable Palm oil 60,00% 50,00% 55,69% 55,49% 52,59% 47,46% 40,00% 42,96% 42,58% 30,00% 20,00% 10,00% 0,00% Q1 2014 Q2 2014 Q3 2014 Q4 2014 Q1 2015 Q2 2015 Sustainable palm kernel oil 50,00% 40,00% 44,62% 43,29% 41,83% 37,01% 37,33% 30,00% 33,22% 20,00% 10,00% 0,00% Q1 2014 Q2 2014 Q3 2014 Q4 2014 Q1 2015 Q2 2015 2
Palm product used by FEDIOL members -1 st quarter 2014 up to 2 nd quarter 2015 Palm oil 1.500.000 1.000.000 471.673 499.936 496.975 349.716 483.777 331.484 500.000 522.059 464.388 450.768 447.006 384.993 398.644 0 Q1 2014 Q2 2014 Q3 2014 Q4 2014 Q1 2015 Q2 2015 Non certified PO Certified PO Palm kernel oil 100.000 80.000 36.909 60.000 33.000 26.383 27.274 40.000 18.453 13.665 51.325 44.299 43.237 20.000 33.849 31.408 27.476 0 Q1 2014 Q2 2014 Q3 2014 Q4 2014 Q1 2015 Q2 2015 Non certified PK Certified PK 3
High share of segregated and identity preserved sustainable palm oil and palm kernel oil Sustainable palm oil 500.000 400.000 300.000 200.000 100.000 0 Q1 2014 Q2 2014 Q3 2014 Q4 2014 Q1 2015 Q2 2015 Mass balance Segregated Sustainable palm kernel oil 35.000 30.000 25.000 20.000 15.000 10.000 5.000 0 Q1 2014 Q2 2014 Q3 2014 Q4 2014 Q1 2015 Q2 2015 Mass balance Segregated 4
Recommend
More recommend