2-D and 3-D Coordinates For M-Mers And Dynamic Graphics For Representing Associated Statistics By Daniel B. Carr dcarr@gmu.edu George Mason University
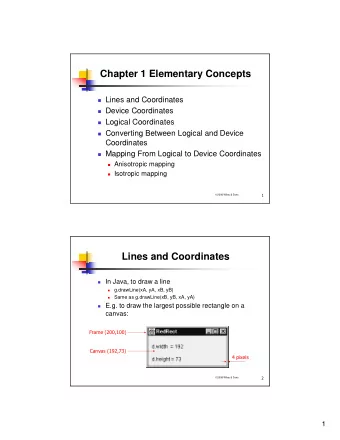
Overview • Background • Encoding and self-similar coordinates • Examples • Rendering software – GLISTEN • Closing remarks
Background • Task – Visualize statistics indexed by a sequence of letters • Letter-Indexing – Nucleotides: AAGTAC – Amino Acids: KTLPLCVTL – Terminology: blocks of m letters called m-mers • Statistics: counts or likelihoods for – Short DNA sequence motifs for transcription factor binding: gene regulation – Peptide docking on immune system molecules
Graphical Design Goals • Provide an overview and selective focus • Use geometric structures to – Organize statistics – Reveal patterns – Provide cognitive accessibility • Incorporate scientific knowledge in layout choices – Enhance patterns and simplify comparisons
Common Practice - Tables • Published tables – a linear list – Sorted by values of a statistic – Indexing letter sequences shown as row labels – Only few items shown of thousands to millions
Common Practice - Graphics • 1-D histograms – some examples – Nucleotides: Distribution of promoters by distance upstream from the start codon – Amino acids: • Sequence alignment logo plots are one variant • Docking counts by position • Cell-colored matrices? – More commonly used for microarray data and correlation matrices
HLA-A2 Molecule Peptide Docking Counts By Amino Acid Given Position Pos 1 Pos 2 Pos 3 Pos 4 Pos 5 Pos 6 Pos 7 Pos 8 Pos 9 A C D E F G H I K L M N P Q R S T V W Y 50 50 150 250 50 50 50 50 50 50 50 150
Graphical Encoding Ideas: Use Points For M-Mers • Represent m-mers using coordinates – A point stands for an m-mer – A glyph at the point represents statistics for that m-mer. For example point color, size, shape • Challenge – The domain of all letter sequences is exponential in sequence length – Display space is limited
Self-Similar Coordinates • Self-similarity helps us keep oriented – Parallel coordinate plots are increasingly familiar • Coordinates from 3-D geometry – 4 Nucleotides => tetrahedron – 20 Amino acids • Icosahedron face centers • Familiar coordinates => hemisphere • Two kinds of self-similarity – At different scales => fractals – At the same scale => shells, surfaces
Self-Similarity At Different Scales: Nucleotide Example • Represent each 6-mer as a 3-D point – (4 nucleotides) 6 = 4096 points • Attractor: tetrahedron vertices – A=(1,1,1), C=(1,-1,-1), G=(-1,1,-1), T=(-1,-1,1) • Computation: – Hexamer position weights: 2^(5,4,3,2,1,0)/63 – ACGTTC -> (.555, .270, .206)
Application: Gene Regulation Studies • Cluster genes based on – Gene expression levels in different situations – Other criteria such as gene family • For each cluster look in gene regulation regions for recurrent nucleotide patterns – Over expressed m-mers: potential transcription factor docking sites • Show frequencies (or multinomial likelihoods)
Nucleotides Example Yeast Gene Regulation 29 Genes in a cluster Sliding hexamer window 300 letters upstream from – YBL072c open reading frames – YDL130w – 300 ATATGA – YDR025w – 299 TATGAG – … – 298 ATGAGT – YCL054w – 297 TGAGTA
Statistics • Number of genes with hexamer – TTTTTC 22 – GAAAAA 21 – TTTTTT 19 – AAAAAT 19 – TTTTCA 18 – ATTTTT 17 • Total number of appearances, etc.
Extensions • 2-D version (projected gasket) – 10mers => 1024 x 1024 pixel display • Wild card and dimer counts – TACC……GGAA • Include more scientific knowledge – Special representations for known transcription factors • More interactivity – Filtering for regions upstream – Mouseovers, etc.
Self-Similarity At Different Scales: Amino Acids Sequence Coordinates • Represent each 3-mer as a 3-D point – (20 amino acids) 3 = 8000 points • Attractor: icosahedron face centers – Let x1= .539, x2=.873, x3=1.412 – A=(x1,x3,0), C=(0,x1,x3), … Y=(-x3,0,-x1) • Computation Position weights: 3.8 (2,1,0) scaled to sum to 1. Letters HIT => (-1.26, -1.08, .180)
Graphical Encoding Ideas: Paths • Use paths connecting m-mer points to represent longer sequences – Path features, thickness and color can encode statistics indexed by the concatenated m-mers – Can reuse the m-mers keeping a common framework – 3 3-mers -> two segment path -> 9 mer • Challenges – Overplotting, path ambiguity, prime sequence lengths – Using translucent triangles for triples is poor, etc.
Letter x Position Coordinates And Paths • Merits – Few points and simple structure • 20 amino acids by 9 positions = 180 points • Challenges – Path overplotting =>filtering – Avoiding path interpretation ambiguity in higher dimensional tables => 3-D layouts
Self-Similarity At The Same Scale: Amino Acids Coordinates • Each point represents a letter and position pair – 9-mers: 20 letter x 9 positions = 180 points • Geometry: icosahedron face centers – Let x1= .539, x2=.873, x3=1.412 – A=(x1,x3,0), C=(0,x1,x3), … Y=(-x3,0,-x1) • Use scale factor for a given position – Scale factors for 9-mers: 2.2, 2.4, 2.6, …, 3.6 – A1 => 2.2*(x1,x3,0) C2=>2.4*(0,x1,x3) • Problem: overplotting of paths
Self-Similarity At The Same Scale: Amino Acids Example • Each point represents a letter and position pair – 9-mers: 20 letter x 9 positions = 180 points • Geometry: hemisphere – Amino acid: longitude, Position: latitude – Amino acid ordering • Group by chemical properties: hydrophobic, etc. • Order to minimize path length in given application – Include gaps for perceptual grouping • Path overplotting still a problem, need filtering
Peptide Docking Example • Immune system molecules combine with peptides to form a complex recognized by T-cell receptors – Problems: • Failure to dock foreign peptides • Docking with “self” peptides • Molecule specific databases of docking peptides – MHCPEP 1997, Brusic, Rudy, and Harrison – Human leukocyte antigen (HLA) A2, class 1 molecule • Small: about 500 peptides of 20 9 = ½ trillion possibilities • Mostly 9-mers (483) • Positions related to asymmetric docking groove
Peptide Docking Interests • Which amino acids appear in which position? • Characterize the space of • docking, not-docking, unknown • Prediction of unknowns • Focused questions • Is there a docking peptide in a key protein common to all 23 HIV strains?
Docking Statistics Number of the 483 peptides with the amino acid in position 2 M Q P S T F V A L G I K R H E D C W N Y 45 4 1 1 23 2 16 14 294 1 71 5 2 0 2 1 1 0 0 1 Cells from the collection of all 4-position tables: 126 tables of potentially 20 4 = 160000 cells each G4 F5 V6 F7: 35 L2 A7 A8 V9: 29 …
Graphics Software • GLISTEN – Geometric Letter-Indexed Statistical Table Encoding – Swap out coordinates at will with tables unchanged – NSF research: second generation version in progress • Available partial alternatives – CrystalVision ftp://www.galaxy.gmu.edu/pub/software/ – Ggobi www.ggobi.org/download.html
Hemisphere Plot Versus Parallel Coordinate Plots • PC plots are – Better for the many scientists preferring flatland – Straight forward to publish – Ambiguous when connecting non-adjacent axes • Hemisphere plots – 3-D curvature reduces line ambiguity and provides a general framework for tables involving non-adjacent positions – 3-D provides more neighbor options to group amino acids based on chemical properties: non-polar, etc.
Closing Remarks • Docking applications are still evolving – New procedures for inference and better databases • Graphics still need work – More scientific structure – Work on cognitive optimization • GLISTEN can address many other applications
Graphics Reference • Lee, et al. 2002, “The Next Frontier for Bio- an Cheminformatics Visualization,” IEEE Computer Graphics and Applications, Sept/Oct pp,. 6-11.
Relate Scientific References (1) Spellmen, et al. 1998. “Comprehensive Identification of Cell Cycle-regulated Gened of the Yeast Saccharomyces c ervisiae by Microarray Hybridization,” Molecular Biology of the Cell. Vol 9, pp. 3273-3297. Keles, van der Laan, and Eisen. 2002. “Identification of regulatory elements using a feature selection method.” Bioinformatics, Vol. 18. No 9. pp1167-1175.
Related Scientific References (2) • Segal Cummings and Hubbard. 2001. “Relating Amino Acid Sequences to Phenotypes: Analysis of Peptide-Binding Data,” Biometrics 57, pp. 632-643.
Recommend
More recommend
Unleash a World of Digital Possibilities—Browse, Share, and Explore Content Without Boundaries