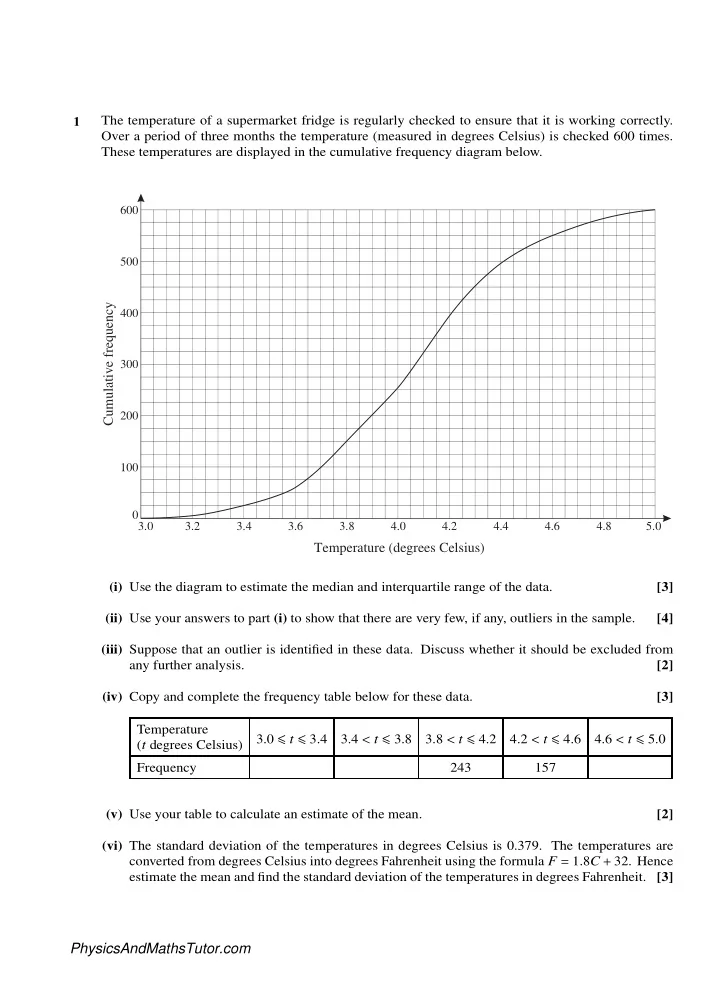

1 The temperature of a supermarket fridge is regularly checked to ensure that it is working correctly. Over a period of three months the temperature (measured in degrees Celsius) is checked 600 times. These temperatures are displayed in the cumulative frequency diagram below. 600 500 Cumulative�frequency 400 300 200 100 0 3.0 3.2 3.4 3.6 3.8 4.0 4.2 4.4 4.6 4.8 5.0 Temperature�(degrees�Celsius) (i) Use the diagram to estimate the median and interquartile range of the data. [3] (ii) Use your answers to part (i) to show that there are very few, if any, outliers in the sample. [4] (iii) Suppose that an outlier is identified in these data. Discuss whether it should be excluded from any further analysis. [2] (iv) Copy and complete the frequency table below for these data. [3] Temperature 3.0 ≤ t ≤ 3.4 3.4 < t ≤ 3.8 3.8 < t ≤ 4.2 4.2 < t ≤ 4.6 4.6 < t ≤ 5.0 ( t degrees Celsius) Frequency 243 157 (v) Use your table to calculate an estimate of the mean. [2] (vi) The standard deviation of the temperatures in degrees Celsius is 0.379. The temperatures are converted from degrees Celsius into degrees Fahrenheit using the formula F = 1.8 C + 32. Hence estimate the mean and find the standard deviation of the temperatures in degrees Fahrenheit. [3] PhysicsAndMathsTutor.com
2 The histogram shows the amount of money, in pounds, spent by the customers at a supermarket on a particular day. (i) Express the data in the form of a grouped frequency table. [2] (ii) Use your table to estimate the total amount of money spent by customers on that day. [2] PhysicsAndMathsTutor.com
3 A GCSE geography student is investigating a claim that global warming is causing summers in Britain to have more rainfall. He collects rainfall data from a local weather station for 2001 and 2006. The vertical line chart shows the number of days per week on which some rainfall was recorded during the 22 weeks of summer 2001. (i) Show that the median of the data is 4, and find the interquartile range. [3] (ii) For summer 2006 the median is 3 and the interquartile range is also 3. The student concludes that the data demonstrate that global warming is causing summer rainfall to decrease rather than increase. Is this a valid conclusion from the data? Give two brief reasons to justify your answer. [3] PhysicsAndMathsTutor.com
4 The numbers of absentees per day from Mrs Smith’s reception class over a period of 50 days are summarised below. Number of absentees 0 1 2 3 4 5 6 > 6 Frequency 8 15 11 8 3 4 1 0 (i) Illustrate these data by means of a vertical line chart. [2] (ii) Calculate the mean and root mean square deviation of these data. [3] (iii) There are 30 children in Mrs Smith’s class altogether. Find the mean and root mean square deviation of the number of children who are present during the 50 days. [2] 5 The times taken for 480 university students to travel from their accommodation to lectures are summarised below. Time ( t minutes) 0 ≤ t < 5 5 ≤ t < 10 10 ≤ t < 20 20 ≤ t < 30 30 ≤ t < 40 40 ≤ t < 60 Frequency 34 153 188 73 27 5 (i) Illustrate these data by means of a histogram. [5] (ii) Identify the type of skewness of the distribution. [1] PhysicsAndMathsTutor.com
Recommend
More recommend