08/05/2014 Interaction between stress induced by Introduction - PDF document
08/05/2014 Interaction between stress induced by Introduction competition and an insecticide on the ERA based on extrapolations from single-species tests to response of aquatic invertebrates the whole ecosystem Ecological interactions
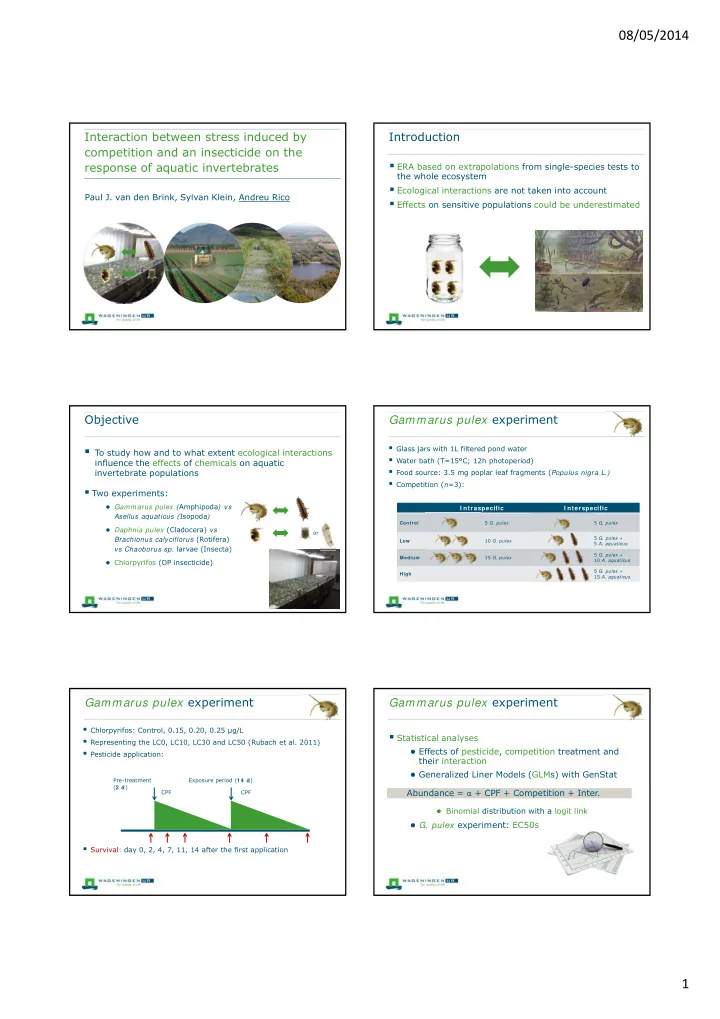
08/05/2014 Interaction between stress induced by Introduction competition and an insecticide on the ERA based on extrapolations from single-species tests to response of aquatic invertebrates the whole ecosystem Ecological interactions are not taken into account Paul J. van den Brink, Sylvan Klein, Andreu Rico Effects on sensitive populations could be underestimated Objective Gammarus pulex experiment Glass jars with 1L filtered pond water To study how and to what extent ecological interactions Water bath (T=15°C; 12h photoperiod) influence the effects of chemicals on aquatic Food source: 3.5 mg poplar leaf fragments ( Populus nigra L.) invertebrate populations Competition ( n =3): Two experiments: ● Gammarus pulex ( Amphipoda ) vs I ntraspecific I nterspecific Asellus aquaticus ( Isopoda ) 5 G. pulex 5 G. pulex Control ● Daphnia pulex (Cladocera) vs or Brachionus calyciflorus (Rotifera) 5 G. pulex + 10 G. pulex Low 5 A. aquaticus vs Chaoborus sp. larvae (Insecta) 5 G. pulex + 15 G. pulex Medium ● Chlorpyrifos (OP insecticide) 10 A. aquaticus 5 G. pulex + High 15 A. aquaticus Gammarus pulex experiment Gammarus pulex experiment Chlorpyrifos: Control, 0.15, 0.20, 0.25 µg/L Statistical analyses Representing the LC0, LC10, LC30 and LC50 (Rubach et al. 2011) ● Effects of pesticide, competition treatment and Pesticide application: their interaction ● Generalized Liner Models (GLMs) with GenStat Pre-treatment Exposure period ( 1 4 d ) ( 2 d ) Abundance = α + CPF + Competition + Inter. CPF CPF ● Binomial distribution with a logit link ● G. pulex experiment: EC50s Survival: day 0, 2, 4, 7, 11, 14 after the first application 1
08/05/2014 Gammarus pulex experiment Gammarus pulex experiment Intraspecific competition Interspecific competition Pesticide Concentration Pesticide Concentration 0 .1 5 µg/L 0 .2 0 µg/L 0 .2 5 µg/L Control 0 .1 5 µg/L 0 .2 0 µg/L 0 .2 5 µg/L Control 100 100 100 100 100 100 100 100 % Survival % Survival 80 80 80 80 80 80 80 80 % survival % survival % survival % survival % survival 60 60 60 60 60 60 60 60 40 40 40 40 40 40 40 40 20 20 20 20 20 20 20 20 0 0 0 0 0 0 0 0 ‐ 2 0 2 4 7 11 14 ‐ 2 0 2 4 7 11 14 ‐ 2 0 2 4 7 11 14 ‐ 2 0 2 4 7 11 14 ‐ 2 0 2 4 7 11 14 ‐ 2 0 2 4 7 11 14 ‐ 2 0 2 4 7 11 14 ‐ 2 0 2 4 7 11 14 Day Day surviv Day Day survi Competition level: Competition level: Day % Control val Day Day Low Medium % Control Low Medium High Day al Sign. effect (day 4 and 7) Sign. effect (all sampling days) Density Survival Density A. aquaticus Survival G. pulex EC50-7d: Control 0.07 - Low 0.09 - Medium 0.12 µg/L EC50-7d: Control 0.07 - Low 0.18 - Medium >0.25 - High >0.25 µg/L Daphnia pulex experiment Daphnia pulex experiment Glass jars with 1L WC-medium Chlorpyrifos: Control, 0.10, 0.40, 0.75 µg/L Water bath (T=20°C; 12h photoperiod) Representing the EC0, EC10, EC30 and EC50 (pre-test) Food source: Scenedesmus obliquus (0.5g/C per jar) Pesticide application: Competition and predation ( n =3): Pre-treatment Exposure period ( 2 1 d ) I ntraspecific I nterspecific Predation ( 3 d ) CPF CPF CPF 10 D. pulex 10 D. pulex 40 D. pulex Control 10 D. pulex + 10 D. pulex + 20 D. pulex Low 333 B. calyciflorus 1 Chaoborus sp. 10 D. pulex + 40 D. pulex Medium 666 B. calyciflorus Abundance: day 0, 2, 4, 7, 14, 21 after the first application 10 D. pulex + High 999 B. calyciflorus Separated into age classes: adults, sub-adults, juveniles 20% adults 80% sub-adults Daphnia pulex experiment Daphnia pulex experiment Intraspecific competition Statistical analyses Pesticide Concentration ● Effects of pesticide, competition/predation treatment and their interaction 0 .1 0 µg/L 0 .4 0 µg/L 0 .7 5 µg/L Control 1000 1000 1000 1000 ● Generalized Liner Models (GLMs) with GenStat Number/L 100 100 100 100 10 10 10 10 Abundance = α + CPF + Competition/Predation + Inter. 1 1 1 1 ‐ 3 0 2 4 7 14 21 ‐ 3 0 2 4 7 14 21 ‐ 3 0 2 4 7 14 21 ‐ 3 0 2 4 7 14 21 Day ● D. pulex : Poisson distribution with a log link Day Day Day Competition level: Control Low Medium CPF effects only after 2 nd application No sign. effects of competition Sign. decrease juveniles and sub-adults highest exposure 2
08/05/2014 Daphnia pulex experiment Daphnia pulex experiment Interspecific competition Predation Pesticide Concentration Pesticide Concentration 0 .1 0 µg/L 0 .4 0 µg/L 0 .7 5 µg/L 0 .1 0 µg/L 0 .4 0 µg/L Control 0 .7 5 µg/L Control 1000 1000 1000 1000 1000 1000 1000 1000 Num ber/ L Number/L 100 100 100 100 100 100 100 100 10 10 10 10 10 10 10 10 1 1 1 1 1 1 1 1 ‐ 3 0 2 4 7 14 21 ‐ 3 0 2 4 7 14 21 ‐ 3 0 2 4 7 14 21 ‐ 3 0 2 4 7 14 21 -3 0 2 4 7 14 21 -3 0 2 4 7 14 21 -3 0 2 4 7 14 21 -3 0 2 4 7 14 21 Day Day Day Competition level: Control Predation Control Low Medium High Competition level: Days Low exposure, competition favours survival Sign. effect (day 2, 4, 7) No sign. effects of competition Largest effects at controls and low exposure Sign. decrease sub-adults at highest exposure (day 14) Sing. increase of adults/juveniles with concentration Conclusions Conclusions Gammarus pulex experiment Stress by ecological interactions does not necessarily result in higher toxic effects at population level ● Antagonism between pesticide exposure and Predation seems to result in more evident effects than competition competition ● Intraspecific: social behaviour/cannibalism? Effects of competition on pesticide sensitivity more ● Interspecific: predation complex than expected Daphnia pulex experiment Species and context specific e.g. cannibalism/predation ● Competition effects more evident on population Inclusion in intermediate tiers of ERA is still challenging structure than on species abundance Valuable information for ecological models used in ● Predation results in higher effects than competition (Poster WE055) higher-tiers of ERA ● Effects of predation are lower at high exposure concentrations Thanks for your attention ChimERA : an integrated modelling tool for ecological risk assessment – towards more ecologically realistic assessment of chemicals in the environment Kindly funded by: 3
Recommend


![1 2 [ ] AGENDA 20 AUGUST 2014 Review H1/2014 Financial Statements H1/2014 Outlook](https://c.sambuz.com/380523/1-2-s.webp)


More recommend
Explore More Topics
Stay informed with curated content and fresh updates.