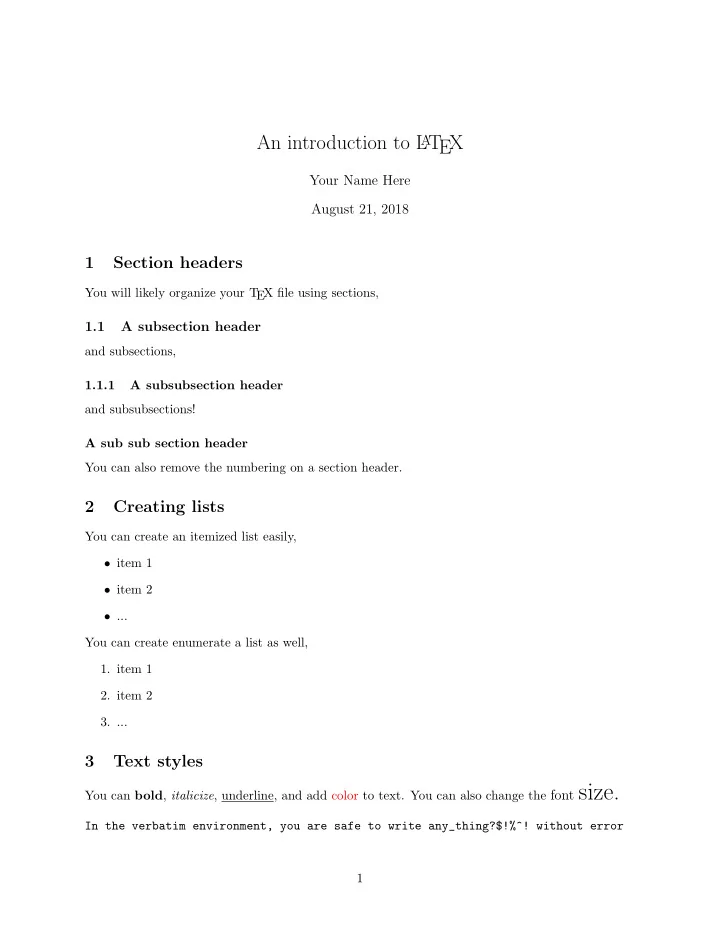

An introduction to L A T EX Your Name Here August 21, 2018 1 Section headers You will likely organize your T EX file using sections, 1.1 A subsection header and subsections, 1.1.1 A subsubsection header and subsubsections! A sub sub section header You can also remove the numbering on a section header. 2 Creating lists You can create an itemized list easily, • item 1 • item 2 • ... You can create enumerate a list as well, 1. item 1 2. item 2 3. ... 3 Text styles You can bold , italicize , underline, and add color to text. You can also change the font size. In the verbatim environment, you are safe to write any_thing?$!%^! without error 1
4 Math mode 4.1 Common-use commands and symbols If I want to type math within a sentence, I can enclose the mathematical expression within single dollar signs (see below), • Greek letters: β , α , π , ǫ , ε , γ , Γ, τ , ρ , φ , Φ, ϕ , ψ , χ , σ , Σ • Other symbols: ⊥ , = ⇒ , → , ∼ , ∈ , ∴ • (In)equalities: ≡ , ≈ , ≥ , ≤ � n � • Operators: � , � n i =1 , � , � n � � 1 0 , � , � , i =1 , , k • Fractions: 1 2 • Exponents / superscripts: e x , e x +1 • Subscripts: β i , β i +1 • Hats: ˆ β , � β , ˜ β • Bold: X , β Here is a more comprehensive list. Also, if you ever get stuck and cannot find the symbol you want via google, this site is amazing. 4.2 Display style in math mode If you want a stand alone equation (on its own line and centered), enclose the mathematical expression within double dollar signs. For example, we can write the following linear model with parameters β 0 and β 1 , E [ Y i | X i ] = β 0 + β 1 X i For proofs or listing multiple equations, you will want to align the equations, � n p y i (1 − p ) 1 − y i L ( p ) = (1) i =1 � n i =1 y i (1 − p ) n − � n i =1 y i = p (2) To easily reference these equations later, give them labels. n � p y i (1 − p ) 1 − y i L ( p ) = (3) i =1 � n i =1 y i (1 − p ) n − � n i =1 y i = p (4) Then, we can reference the above equations 3 and 4 easily. If you do not want any equation numbers, replace align with align* 2
n � p y i (1 − p ) 1 − y i L ( p ) = i =1 � n i =1 y i (1 − p ) n − � n i =1 y i = p 4.3 Brackets and Parentheses You can use parentheses, braces, and brackets to organize your equations. � � � x | µ, σ 2 � 1 − 1 2 σ 2 [ x − µ ] 2 = √ 2 πσ exp f 4.4 Matrices You can create matrices of any size using bmatrix, � 1 � − 1 � 1 � 0 0 = 0 1 0 1 You can use dots to fill in blank space for larger matrices 1 X 12 X 13 . . . X 1 p 1 X 22 X 23 . . . X 2 p X = . . . . ... . . . . . . . . 1 X n 2 X n 3 . . . X np 5 Tables If you are using output from R and for some reason have decided not to use Rmarkdown, you can have R print out your tables in L A T EX using the stargazer or xtable packages. Then, you can easily copy & paste into your tex file. Table 1: My first table Estimates SE 95% CI � 2.34 0.74 (1.47,3.23) β 0 � β 1 0.60 0.16 (0.02,1.21) � β 2 -1.52 0.48 (-2.34, -0.82) If you want to get creative (i.e. add borders, merge rows, etc.), I find it easier to use this website to create your tables for you. 3
6 Graphics If you want to include an image in your file, the image needs to be saved in the same folder as your tex file, or you need to specify the file path. You can also tweak the height and width of the image. If you want to get more creative than this, I recommend this wiki page. 7 Other tips, tricks, and references • Things L A T EX is picky about: dollar signs, brackets, percentages, underscores (outside of math mode), and ampersands. To use these add a backslash before them, i.e. $ % &. Also, when you want to use ”quotes” do “this”. • When you begin writing papers, you should use BibTeX to compile your references for you. It will make your life so much easier. • To create graphical diagrams (e.g. DAGs), use the TikZ package • You can define new command shortcuts for yourself, that way you do not have to type out the more lengthily commands 4
Recommend
More recommend