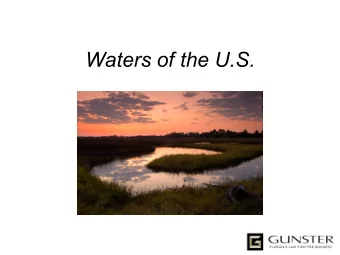
Wa Water Quality Buffers for Wa Waters an and Wetlan lands
2008 Nor’easter: Indian River Bay
Progress Towards Pollution Reduction Goals for the Inland Bays Phosphorus Nitrogen (lbs. per day) (lbs. per day) 1,471 2,427 93 Achieved Achieved Remaining
Water Quality Buffers are… natural areas between development and wetlands or waterbodies; they are managed for the primary purposes of: 1.sustainable removal of pollutants entering wetlands or waterbodies, 2.to protect wetlands or waterbodies against encroachment and physical alterations, and 3.to allow wetlands or waterbodies to maximize their own natural capacities to reduce pollution.
Forested Buffer ~ 200’
Buffer Considerations • Extent • Vegetation • Field Ditches • Views • Approval and Enforcement • Width
Headwaters(small streams) make up ~75% of total waterway length Headwaters are more efficient at removing pollution than larger streams
Vegetation Turf Type Turf vs. Forest • Forested buffers remove 36% more nitrogen on average than grassed buffers Forest • Forested buffers take up 11 – 37 lbs of nitrogen and 2 – 5 lbs of phosphorus per acre per year into wood • Soil organic matter is over twice as high in forested buffers • Forested buffers improve instream processing of nutrients • Forested buffers support wildlife habitat and don’t contribute pollution
Effect of Buffer Width on Nitrogen Removal for 17 Atlantic Coastal Plain Riparian Buffers Effect of Buffer Width on Nitrogen Removal from 17 Atlantic Coastal Plain Riparian Buffers 140 120 100 80 % Nitrogen Removal 60 40 20 0 y=-7915.6564+((8015.6442x)/(0.1813+x)) Rsqr = 0.67 -20 p = 0.0005 ---- = 95% Confidence Int. -40 -60 0 100 200 300 Buffer Width (ft.)
MARSH UPLAND BAY
MARSH UPLAND BAY
DEVELOPMENT MARSH UPLAND BAY
DEVELOPMENT MARSH UPLAND BAY
DEVELOPMENT MARSH UPLAND BAY
DEVELOPMENT MARSH UPLAND BAY SHORELINE ARMOR
DEVELOPMENT MARSH UPLAND BAY SHORELINE ARMOR
MARSH DEVELOPMENT UPLAND BAY SHORELINE ARMOR
DEVELOPMENT MARSH UPLAND BAY
Mouth of Guinea Creek Bay Shoreline Bay Shoreline Upland/Wetland Upland/Wetland Boundary Boundary
Rates of tidal wetland migration derived from metric mapping analysis 1926-1989 Rehoboth Slope of Adjacent Upland Indian River Bay Bay Gradual (<0.08 rise/run) 5.25 ft/yr 6.07 ft/yr Steep (>0.09 rise/run) 1.44 ft/yr 0.82 ft/yr
Fi Field Ditches
Approval and Enforcement
Buffer Ordinance Comparison New Castle Kent Co., Sussex Co., New Jersey Maryland CIB CIB Co., DE DE DE Critical Areas Adequate Optimum Tidal Wetlands & 100 ft. 100 ft. 50 ft. 300 ft. 200 ft. 80-300 ft. 150-500 ft. Waters Nontidal Wetlands 50 ft. 25 ft. 0 ft. 0 – 150 ft. 25 ft. 50 100 Headwaters 100 ft. 50 ft. 0 ft. 300 ft. 100 ft. 35 - 80 35 -150 Larger/Perennial 100 ft. or 50 100 ft. 0 – 50 ft. 300 ft. 100 ft. 80 150 Waterways ft. from floodplain Vegetation Type Natural/ Natural Natural/ Existing Natural Natural Natural Forest Vegetation or /Forest Forest /Forest /Forest /Forest Natural /Forest Vegetation Existing Existing Existing Existing Existing natural Existing Existing Preservation native natural natural vegetation native native vegetation vegetation buffers buffers vegetation vegetation Buffer Mgmt. Plan No No No Yes Yes Yes Yes
Analysis of Recommendations Applied to Developments • 11 randomly selected PLUS applications: ’04-’06. l Separated into large (>75 th percentile) & small projects (<50 th Well percentile) and by Drained watershed region Region l Estimated % developable acreage as Poorly buffer by waterbody Drained Region type and buffer alternative
Results • On average, buffers were within range of current County open space requirements • Adequate = 13.8% of developable acreage • Optimum = 33.2% of developable acreage • Sites with tidal wetlands by low lying uplands had very large areas as buffers • Encourage filling or integration into stormwater controls those ditches unnecessary for drainage. • Smaller buffer widths should be afforded (>35’) on shallow ditches (< 3 ft deep) to allow buffering of other features
Applying Recommendations: Bethany Woods Acreage 12 Site Characteristics Developable Ac. 9 % Dev. Ac. in Buffer (Adequate) 61 % Dev. Ac. in Buffer (Optimum) 89 Buffer Types Development Nontidal Waterway Waterbody Type Tidal Nontidal Wetland Nontidal Wtlnds Tidal Wetlands Major Ditches Adequate Alternative Optimum Alternative
Applying Recommendations: Bridlewood Acreage 314 Site Characteristics Developable Ac. 309 % Dev. Ac. in Buffer (Adequate) 1.8 % Dev. Ac. in Buffer (Optimum) 3.7 Buffer Types Development Nontidal Waterway Waterbody Type Tidal Nontidal Wetland Nontidal Wtlnds Tidal Wetlands Optimum Alternative Adequate Alternative
Years buffers of different widths are estimated to provide protection to tidal wetlands Indian River Bay Rehoboth Bay Upland Buffer Gradual Steep Gradual Steep Width Slope Slope Slope Slope 50’ 10 35 8 61 75’ 14 52 12 91 100’ 19 69 17 122 200’ 38 139 33 244 300’ 57 208 49 366 400’ 76 278 66 488 500’ 95 347 82 610 derived from metric mapping analysis 1926-1989
Recommend
More recommend
Unleash a World of Digital Possibilities—Browse, Share, and Explore Content Without Boundaries