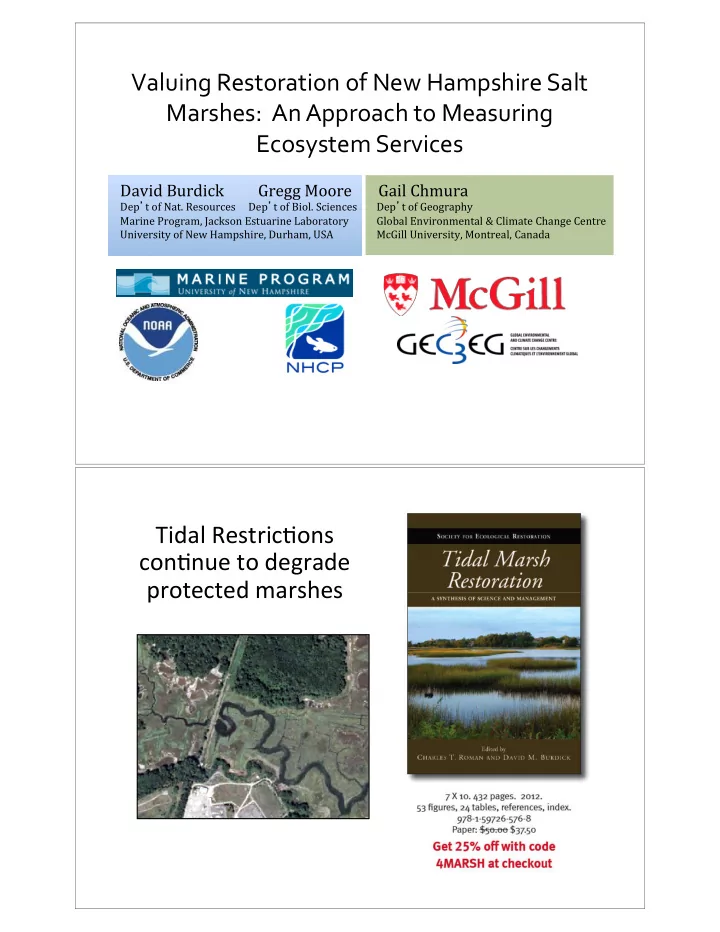

Valuing(Restoration(of(New(Hampshire(Salt( Marshes:((An(Approach(to(Measuring( Ecosystem(Services ! David&Burdick&&&&&&&&&Gregg&Moore&&&&&&&Gail&Chmura Dep � t&of&Nat.&Resources& &Dep � t&of&Biol.&Sciences &Dep � t&of&Geography&& Marine&Program,&Jackson&Estuarine&Laboratory& &Global&Environmental&&&Climate&Change&Centre& University&of&New&Hampshire,&Durham,&USA & &McGill&University,&Montreal,&Canada ! Tidal!Restric-ons! con-nue!to!degrade! protected!marshes!
Restoration can be costly – is it worth it? Evalua-ng!Restora-on! ? • � Success � ,!Pass/Fail?!!! • Defined!by!Acres,!Structure,!Func-on?! • No!Unified!Method,!No!Unified!Parameters! • Can!sites!be!compared?! readily ,! meaningfully ?! ! Photo: G.E. Moore
Gulf!of!Maine! � GPAC � !Protocols! • Hydrology! Tidal!Signal!(WL!Recorders),!Eleva-on! • Soils!and!Sediments! Salinity!(and!Sulfide,!Eh,!%C,!accre-on)! • Vegeta-on! Abundance,!Composi-on,!Invasive!spp,!Ht.! • Nekton! ID,!Density,!Length,!Biomass,!Richness! • Birds! Abundance,!Richness,!Behavior! Neckles et al. 2002. Restoration Konisky et al. 2004. Ecology. 10(3):556-563. RPI – An Evaluation Tool RPI Summary Scores 2 Nekton Vegetation Pore water Hydrology Reference (Tref) Reference Marsh Value 1 Restoration RPI Score Trajectory Restoration Starting Point 0 0 1 2 3 4 5 6 7 8 9 10 Calculates % Change towards Reference/Project Goal Normalizes actual data into a relative index score -1 Time (years)
RESTORATION PERFORMANCE INDEX (Salinity present – Salinity pre-restoration ) Restora-on!change ! (Salinity reference –Salinity pre-restoration ) RPI = Ini-al!difference!from! (20ppt – 10ppt) reference ! = 0.5 (30ppt – 10ppt) ! Example!Marsh!Scenario! 4 Functional Areas Each = 1/4 Contribution Hydrology Vegetation Pore water Nekton -Salinity (psu) - Abundance -Tidal Range - Native % Cover -Redox (mV) - Diversity -Flooded Area - Biomass -Sulfide (mM) Calculates % Change towards Reference/Project Goal Normalizes actual data into a relative index score
Case Study: Little River Marsh, NH Case Study: Little River Marsh, NH
RPI!Calcula-ons!for!LiUle!River!Marsh! F,'+)@)H4+,I F,'+)D)H4&67I !"#$"% F,'+)J F,'+)K !"#$%&#'()*+,' -&+,).'+/'0(, 1,23 4+,51,673 1,23 1,673 &!' 1,23 1,673 1,23 1,673 !"#$%&'(()#)%*+,% 89:+&(&;9 -."/01%2/)# 3456 7858 3456 3359 ()** 3456 3359 3456 3359 !"#$%&'(()#)%*+,% :#$.%2/)# 945; <5< 945; =75> ()** 945; =75> 945; =75> ?(@#0A$'%B$01#%*C,% -."/01%2/)# 95== <58= 954> 95>; *)+, 954> 95>; 954> 95>; ?(@#0A$'%B$01#%*C,% :#$.%2/)# 956; <56> 959= <5== *)-. 959= <5== 959= <5== 4&+,)<'7,+ -$'/0/@D%*..@, 6;56 9=58 685< 685= ()** 6356 6;5; >958 >95< .,;,7'%&# E$'(.FD@#%G(H#"%*+, ;853 8353 =<53 >353 *)** ;75; >758 I0H$J/H#%G(H#"%*+, <5< 9<56 <5< 65= *)-/ <59 659 =,>7&# K#0J/@D%*LMC6, 6<59 965= -.#N/#J%B/NF0#JJ =58 >59 14? @3AB @3C@ @3CB @3CD F,'+)G F,'+)A F,'+)E F,'+)C !"#$%&#'()*+,' -&+,).'+/'0(, 1,23 1,673 1,23 1,673 1,23 1,673 1,23 1,673 !"#$%&'(()#)%*+,% 89:+&(&;9 -."/01%2/)# 3456 3359 3456 3359 3456 3359 3456 3359 !"#$%&'(()#)%*+,% :#$.%2/)# 945; =75> 945; =75> 945; =75> 945; =75> ?(@#0A$'%B$01#%*C,% -."/01%2/)# 954> 95>; 954> 95>; 954> 95>; 954> 95>; ?(@#0A$'%B$01#%*C,% :#$.%2/)# 959= <5== 959= <5== 959= <5== 959= <5== 4&+,)<'7,+ -$'/0/@D%*..@, >958 6753 6857 935; 665= 6>5; 645; 6357 .,;,7'%&# E$'(.FD@#%G(H#"%*+, % % ;45< 8954 ;>57 ;>5; I0H$J/H#%G(H#"%*+, % % <5< 953 <5< >59 =,>7&# K#0J/@D%*LMC6, >85; 9>54 >85; >45< -.#N/#J%B/NF0#JJ % % 35< 75< ;5<< 35< 14? @3EC @3AD @3BD ) @3BD RPI!Scores!for!LiUle!River!Marsh! 1.00 !"#$%&' (")"$*+%&' ,%-"'.*$"-' /01-%2%)0' 0.75 RPI Score 0.50 0.25 0.00 0 1 2 3 4 5 6 7 Time (years)
NOAA funded study 2009: Moore, Burdick, Peter, Leonard-Duarte and Dionne REGIONAL ASSESSMENT OF TIDAL MARSH RESTORATION IN NEW ENGLAND USING THE RESTORATION PERFORMANCE INDEX RPI Summary Scores 2 Nekton Vegetation Pore water Hydrology Reference (Tref) 4 PARAMETERS Pore Water , Vegetation , Nekton and Hydrology Data 6-7 yrs ? RPI Score 1 0 0 1 2 3 4 5 6 7 8 9 10 Time (years) Measuring Salt Marsh Plant, Soil, and Hydrologic Response to Restoration Using Performance Benchmarks from Local Reference Systems at NERRs M. Dionne, C. Peter*, K. Raposa, S. Lerberg, J. Fear, C. Cornu, N. Garfield ! RESERVE% HYDROLOGIC%% EXCAVATION% Wells,0ME0 4! (1!reference!site)! Narraganse4,0RI0 5! (!3!reference!sites)!! Ch esapeake0Bay,0VA00 3! (2!reference!sites)! North0Carolina0 3! (1!reference!site)! South0Slough,0OR0 2! 1! (2!reference!sites)! Total!Restora-on!Sites! 11! 7!
Valuing%benefits%from%salt%marsh% restoraBon ! Assessment: Structural indices (hydrology, soils, vegetation, nekton) Goals: To restore natural functions To provide benefits or values to people -a disconnect FuncBonal%values%associated%with%Bdal%marshes: ! ! • Plant growth to support food webs • Removal of sediments and excess Secondary production - fisheries • nutrients • Plant structure to provide habitat • Aesthetic, Recreational & • Support of biodiversity Educational values • Protection from flooding • Self-sustaining ecosystems • Protection from coastal erosion • Long term carbon storage
Ecosystem%Services ! Daily et al. 1997 Costanza et al. Millennium Zedler & Brander et al. 1997 Assmnt. 2005 Kircher 2005 2006 No Particular Tidal marsh & Estuaries & Wetlands Wetlands Ecosystem mangroves marshes not included food production; fiber, timber, fuel food production; commercial and raw materials raw materials recreational fishing & hunting; harvesting of natural materials; energy resources maintenance of habitat/refugia biodiversity habitat/refugia appreciation of species biodiversity existence provision of aesthetic recreation cultural & cultural; recreation recreational activities; beauty and amenity; appreciation of intellectual aesthetics; uniqueness to stimulation that lift the recreational culture/heritage human spirit protection of coastal disturbance flood/storm disturbance storm protection flood shores from erosion regulation protection; regulation protection by waves. erosion control protection - UV rays; not included atmosphere & gas regulation climate stabilization; climate stabilization; climate regulation reduced global moderation of warming weather extremes & impacts. purification of air & waste treatment waste processing waste treatment improved water quality; water; detoxification waste disposal & decomposition of wastes cycling & movement none nutrient cycling & nutrient cycling improved water quality; of nutrients fertility waste disposal Value!of!Tidal!Marsh!Ecosystem! Services!per!Annum!per!Hectare ! • Costanza!et!al.!1987:!!$9,900! • In!2008!$!(Gedan!et!al.!2009):!$14,400! • Carbon!sequestra-on!(European!market):!$135! • Denitrifica-on!(Piehler!and!Smyth!2011):!$6,128!
Value!of!Tidal!Marsh!Ecosystem! Services!per!Annum!per!Hectare ! • Will!researchers!develop!beUer!es-mates!for! specific!func-onal!values!over!-me?! • Will!some!values!overlap!and!perhaps!conflict?! !!!!!!!!!!!!!!!!!!!!!!!!!!!!!!!!!PROBABLY!! ! But!.!.!.Let � s!take!the!next! step!anyway
New%ValuaBon%Strategy ! Take:% Ecological!Valua-on! i!structural!and!func-onal!indicators! used!to!measure!marsh!response!to!restora-on! Set%it%equal%to:% Economic!Valua-on! –!ecosystem!service!values!of! Costanza!et!al.!1997!(2008:!$14,400/ha/yr)! Net Gain in Reference! Impacted! Restored! Ecosystem Marsh! Marsh! Marsh! Services = 100%! 39%! 89%! Time $7200/ha/yr 100% = 39% = 89% = $14,400 /yr $5,600 /yr $12,800 /yr RPI!Scores!for!LiUle!River!Marsh! 1.00 !"#$%&' (")"$*+%&' ,%-"'.*$"-' /01-%2%)0' 0.75 RPI Score 0.50 0.25 0.00 0 1 2 3 4 5 6 7 Time (years) Calcula-on!of!Value!of!Net!Benefits!from!Ecosystem! Services! RPI%=%0.91%in%Year%7;%% Value%lost%due%to%impacts%from%Bdal%restricBon%=%41%% Year%7%value%relaBve%to%reference%marsh%=%0.91%% SO%.%.%Restored%benefits%=%$14,%400/ha%*%0.41%*%0.91%*%70%ha% %%%%%%%%%%%%%%%%%%%%%%%%%%%%%%%%%%%%%%=%$376,000%
OVER%first%5%years%(2001`2005)%=%$1.2%million% OVER%next%6%years%(2006`2011)%=%$2.2%million% Cost%%$1.3%million%% Thank you
Recommend
More recommend