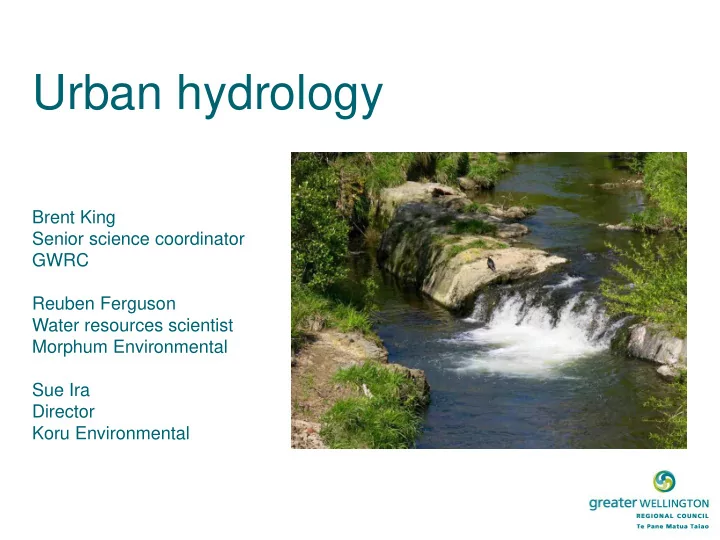
Urban hydrology Brent King Senior science coordinator GWRC Reuben - PowerPoint PPT Presentation
Urban hydrology Brent King Senior science coordinator GWRC Reuben Ferguson Water resources scientist Morphum Environmental Sue Ira Director Koru Environmental Aim of the session Identify the Committees preferences for managing
Urban hydrology Brent King Senior science coordinator GWRC Reuben Ferguson Water resources scientist Morphum Environmental Sue Ira Director Koru Environmental
Aim of the session • Identify the Committee’s preferences for managing urban development for its impact on stream flows
Some info to help • Why manage the effects of runoff? • What does different infill and greenfield development practice get you? – How and why does hydrology differ – How do the effects on stream health differ – How and why do costs differ
Why manage the runoff effects? • One of many factors that affect stream ecology – Water quality (eg, toxicants, temperature) – Flow (eg, low flows, total runoff, disturbances) – Habitat (eg, bank stability, stream bed, shade, passage)
Why manage the runoff effects? • People need places to live • More hard surfaces – more runoff – faster runoff • Cost to develop and live there • Resilience • Climate change • Amenity of the built environment
Your scenarios • Package of interventions covering many factors that affect stream health • Today’s focus is on urban runoff • Improved – Slow the water down – Limited removal of runoff reaching the stream • Water sensitive – Reduce the area of hard surfaces – Slow the water down – Store and remove runoff from reaching the stream
Case studies • Relatively small catchments with lots of urban development in the scenarios • Magnify the effects of urban development and changes in practice within each development type • Results likely to be less dramatic in mixed land use catchments
Results to look for • Annual average runoff – changes indicate a likely shift in the stream ecology towards less diverse macroinvertebrate communities with fewer sensitive species • Frequency of bed disturbing flows – too much disturbance can mean only the tolerant species (typically the small and rapidly species colonising species) survive while sensitive species are lost • Life cycle costs per household – Difference in costs to install and maintain the scenario bundles of stormwater mitigation measures – Split of private and public borne costs
URBAN HYDROLOGY MODELLING TE AWARUA-O-PORIRUA WHAITUA
Case study catchments Greenfield Infill
Hydrology model • Converts rainfall into stormwater runoff • Compare changes in runoff across development scenarios • Effect of landuse changes • Effect of stormwater management devices – Rainwater tanks (reuse of captured water) – Raingardens in streets – Wetlands (reuse of treated water) – Permeable paving • Report results • Annual volume of runoff • Number of bed-disturbing flows per year
Model scenarios • Existing • BAU • Higher dwelling density, greater imperviousness • No mitigation of runoff • Improved • Same density and imperviousness as BAU • Some mitigation of runoff using devices = stormwater detention • WSUD • Same density but reduced imperviousness • Extensive use of runoff mitigation devices = stormwater retention
Model structure (Infill catchment)
Results – Runoff volume Greenfield Infill % volu olume reduction Greenfield BAU to WSUD: 53% Improved: 10% WSUD: 43% Infill BAU to WSUD: 42% Improved: 6% WSUD: 37%
Results – Bed disturbing flows Greenfield Infill
Key messages • Improved scenario • Reduces frequency of bed-disturbing flows • Has small effect on total runoff volume • WSUD scenario • Reduces bed-disturbing flows and total runoff volume • Greatest benefit through stormwater retention • Re-use collected rainwater within houses (constant daily use) • Infiltration of stormwater (less viable) • WSUD approach has wider benefits than just hydrology • Water quality improvement • Amenity enhancement • Reduced demand on mains water supply (rain tanks) • Resilience, e.g. household water supply following earthquake
Results – Cumulative frequency distribution At t 95% Existing: 6 L/s BAU: 20 L/s Improved: 12 L/s WSUD: 5 L/s
THE COST AGGREGATION MODEL PORIRUA WHAITUA
Synopsis…. • What is life cycle costing and how can we use it? • Information on the Porirua Whaitua LCC models (assumptions) • LCC results for our two case study catchments
What is is lif life cycle costing (L (LCC)? Definition: “ …..the process of assessing the cost of a product over its life cycle or a portion thereof…..” Ref: Australian/New Zealand Standard 4536:1999 Treasury New Zealand
$ Cost Phases in the life cycle of a stormwater practice and potentially associated costs (Taylor, 2003)
How th the stormwater LCC model l works • Builds on existing LCC Work • Based on generating a total LCC which includes analysis of TAC and maintenance costs over a 50 year analysis period (base date of 2017) • Relates to: • best practice design of the mitigations • impervious area treated • treatment performance
Understandin ing how to use LCCs • Allows comparison of costs of one or more devices against another • Balances performance (benefits) against cost • Use ranges to express uncertainty due to data gaps or large variation in costs (focus on ranges rather than absolutes) • Look for patterns and relative differences between scenario results • Today’s results are indicative based on the interventions and dwellings in our two case studies only.
Cost Result lts – urban costs TOTAL INDICATIVE ESTIMATE LCC $/ YEAR $900,000 $850,000 $800,000 $670,000 $700,000 $600,000 $495,000 $480,000 $500,000 $400,000 $290,000 $300,000 $260,000 $201,000 $200,000 $144,000 $100,000 $- Low High Low High CAMBORNE GREENFIELDS CASE STUDY KENEPERU INFILL CASE STUDY IMPROVED SCENARIO WSUD SCENARIO
Cost Result lts – urban costs TOTAL INDICATIVE ESTIMATE LCC $/YEAR/DWELLING $1,200 $1,100 $1,000 $900 $800 $600 $400 $360 $400 $200 $150 $140 $60 $40 $- Low High Low High CAMBORNE GREENFIELDS CASE STUDY KENEPERU INFILL CASE STUDY IMPROVED SCENARIO WSUD SCENARIO
Cost Result lts – whic ich costs to use? TOTAL INDICATIVE ESTIMATE LCC $/YEAR/DWELLING $1,200 $1,100 $1,000 $900 $800 $600 $400 $360 $400 $200 $150 $140 $60 $40 $- Low High Low High CAMBORNE GREENFIELDS CASE STUDY KENEPERU INFILL CASE STUDY IMPROVED SCENARIO WSUD SCENARIO
Cost Result lts – public lic / / priv ivate spli lit (u (urban) CAMBORNE GREENFIELD CASE STUDY - CAMBORNE GREENFIELD CASE STUDY - WSUD SCENARIO IMPROVED SCENARIO Proportion of total LCC as public or Proportion of total LCC as public or private private 19% Public portion of total LCC$/yr 41% Public portion of total LCC$/yr Private portion of total Private portion of total LCC$/yr 59% LCC$/yr 81%
Cost Result lts – public lic / / priv ivate spli lit (u (urban) KENEPERU INFILL CASE STUDY - WSUD KENEPERU INFILL CASE STUDY - SCENARIO IMPROVED SCENARIO Proportion of total LCC as public or Proportion of total LCC as public or private private 19% Public portion of total LCC$/yr Public portion of total LCC$/yr 43% Private portion of total LCC$/yr 57% Private portion of total LCC$/yr 81%
Take home messages …... • Costs are indicative estimates of LCCs – relative difference between scenarios • The difference in costs between the ‘improved’ and ‘water sensitive’ scenarios are relatively small • Wetlands are a major driver of the large ranges in cost estimates, particularly for the ‘improved scenario’
Take home messages …... • Keneperu – use high-end of cost range of estimate (infill) • Taupo at Camborne – use low-end of cost range estimate (greenfield) • “Improved’ scenario models a high share of public costs from catchment scale methods to slow water down • “Water sensitive” scenario models higher shares of privately borne costs from the higher use of lot scale retention and in home reuse
Recommend


More recommend
Explore More Topics
Stay informed with curated content and fresh updates.