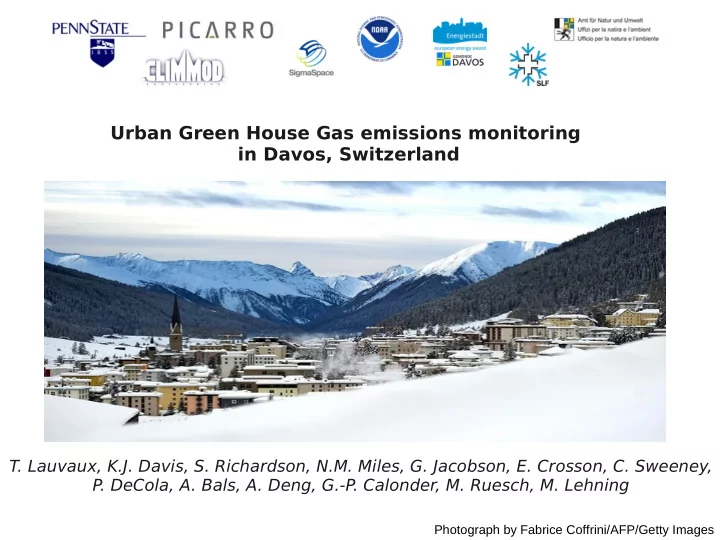

Urban Green House Gas emissions monitoring in Davos, Switzerland T. Lauvaux, K.J. Davis, S. Richardson, N.M. Miles, G. Jacobson, E. Crosson, C. Sweeney, P. DeCola, A. Bals, A. Deng, G.-P. Calonder, M. Ruesch, M. Lehning Photograph by Fabrice Coffrini/AFP/Getty Images
Facts about the World Economic Forum and Davos World Economic Forum Annual meeting in Davos: - Over 2,600 participants - Even more security forces - Traffic: helicopters, cars Davos, Switzerland: - Population: 12,000 permanent residents - Area: 300km 2 with 6km 2 urban - T opography: Steep valley, 3km wide, 1km elevation difference
Carbon budget of Davos: 2005 inventory - Total direct emissions: 85 ktC/year - Main contributors: Heating (fossil fuels): 75% of total emissions Traffic: 17% of total emissions Machines, Waste, ...: about 8% - Emissions per capita: 8 tC/ year/ person (25% above national average) From Walz et al., 2008, in Energy Policy
Demonstration experiment: Emission nowcasting - Instrumentation: T wo 4 species CRDS analyzers from Picarro (CO 2 /CH 4 /CO/H 2 O) One flux analyzer (stability conditions) One Lidar (Aerosols) from SigmaSpace - Modeling tools: Real-time data assimilation system (WRF-FDDA) at 1.3km resolution Emission map based on Walz et al. (2008) mapped on urban cover - Inversion system Linear interpolation based on direct modeling - Daily emission updates and 3D model results posted every morning
Instrumentation: GHG sites - Concept T wo sites (downtown and background) to measure the city plume Use of site-to-site differences Valley circulation in wintertime: emissions trapped in shallow layer No valley breeze and reduced vertical mixing Limitations: stable conditions challenging for models Footprint of the downtown site
Instrumentation: GHG sites - CO 2 atmospheric mixing ratios Strong diurnal cycle despite reduced vertical Mixing (up to 650ppm at night) Constant background (no major sources in the surrounding areas) Site-to-site difference: not correlated with temperature or the WEF meeting - CH 4 atmospheric mixing ratios Strong diurnal cycle despite reduced vertical Mixing (up to 2200ppb at night) Variable background (sources in the surrounding areas): farming? Site-to-site difference: farming activity in Davos
Instrumentation: Lidar - PBL depth evaluation in “unstable” conditions (limited in stable conditions) - T wo PBL schemes used over 2 weeks: Quasi-Normal Scale Elimination (for stable conditions) MYJ scheme
Modeling tools WRF-FDDA modeling system - 4 grids: 36km/12km/4km/1.33km - run twice a day (12 hour intervals) - nudged to WMO database - Using FFDAS emissions for Europe and interpolated inventory for Davos (based on Walz et al., 2008)
Modeling tools WRF-FDDA modeling system - Daily update of model-data residuals to estimate the emissions - 24-hour simulations (each 12 hours) in historical mode - Daily 3D plume videos for visualization of the valley circulation and the CO2 plume Domain of simulation and CO2 plume dynamics over 12 hours
Inversion technique: direct interpolation - Adjoint-free inversion Model-data mismatch from WRF-FDDA First guess from the projected inventory Linearity of the source-receptor function Emissions trapped in the valley => direct interpolation of the source term - CO2 residuals: daily estimates Use site-to-site differences: no boundary conditions Filtering based on wind variance (eddy-flux Site): threshold on u* => daily corrections of prior fluxes
Inverse fluxes: results (no filtering) CO2 emissions in % between December 27 th 2011 and March 1 st The baseline corresponds to the direct emissions from (Walz et al., 2008)
Inverse fluxes: results (no filtering) Correlation between CO 2 emissions and temperature (DD or min) Inversion: 0.57 Consistent with Walz et al., 2008 Prior to WEF: 35% above inventory During WEF: dropped by 40% below pre-WEF levels. Following WEF: 40% above pre-WEF levels (during an extremely cold period)
Decrease during the WEF: Signal or artifact? Decrease during the WEF : Least intuitive response to an increase of 25% of population (using helicopters and limousines) No temperature change compared to January Potential causes: Site location or small tower footprint due to low vertical mixing Transport model error: why during the WEF?
Conclusions - First real-time monitoring system for urban emissions - Promising tool applied to the least model-friendly region on Earth - ... in winter - Consistent temperature dependence with PBL depth evaluation ongoing - Discussions with local scientists (SLF) to maintain GHG measurement sites
Recommend
More recommend