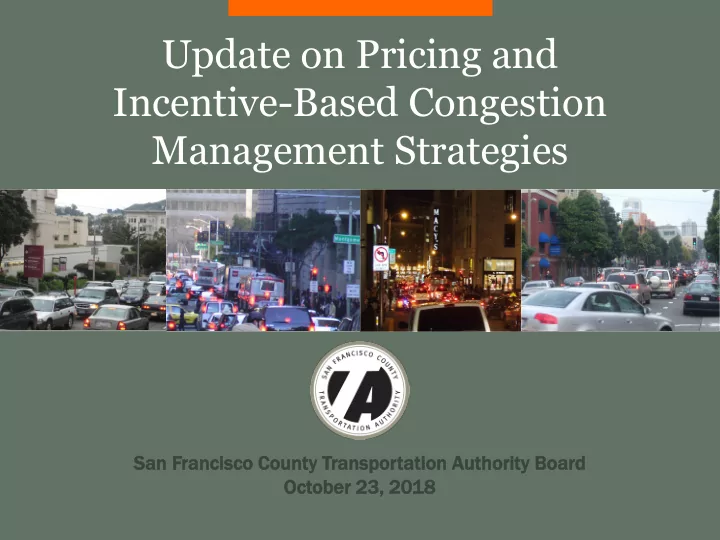

Update on Pricing and Incentive-Based Congestion Management Strategies San an Franci cisco sco County T ty Transp sporta tati tion A Auth thor ority ty Boar ard Oct October 2 23, , 2018
Outline 1.What is Congestion Pricing? 2.Why Study Congestion Pricing? 3.2010 Mobility, Access and Pricing Study 4.Related Efforts in SF and Other Cities 2
What is congestion pricing? One of many tools to manage congestion: • Charge a fee to drive in the most congested locations and times Best practice to package with: • Incentives • Discounts • Multimodal improvements 3
Why study congestion pricing? (circa 2007) Divisadero, 8 am Stockton, 5 pm (Jan 2009) (Jan 2009) 5th most congested region in U.S. • • Peak period trips to Downtown SF twice as long as off-peak trips 3 rd St, 8 am Bush St, 8 am (Jan 2009) (Jan 2009) • SF sacrificed over $2B/yr to congestion Transportation = 37% of SF GHG • emissions Stanyan, 9 am Franklin, 9 am (Jan 2009) (Jan 2009) 4
Why study congestion pricing? (circa 2018) Weekday PM peak delay, 2017 5th most congested region in • the world • SF travelers lose 79 hours/year to congestion • Congestion results in concentrated air pollution, overlaps with COCs • Transportation = 46% of SF GHG emissions 5
2010 Mobility Access and Pricing Study Feasibility Study included: • Substantial community engagement • Wide range of alternatives Effectiveness • Detailed technical analysis • Identification of feasible options Economy Equity Environment 6
MAPS Outreach & Engagement KEY Y STA STAKEHOLDE DER G R GRO ROUPS Equ quity or ty organi aniza zati tions Env nvironmental tal adv advoca cate tes Busi siness g ss groups Resi siden ents, co ts, commute ters BROAD AD O OUTREAC ACH & & MAR MARKET RESEAR EARCH CH Wor orksh shop se op series, s, e-wor orksh kshop op Direct ou ct outr treach ach Public opi c opini nion on pol polls, s, SP su survey ey Inte terce cept su t surveys ys 7
Feedback: community & equity Top concerns: Availability, reliability, and cost of transit services Cost of paying fee to working poor Effect on local/off-peak service due to core/peak demands Traffic/parking diversions at edges of cordon 8
Is Congestion Pricing Fair? Supp pport for Study dyin ing Congest stio ion Pricin cing in in San San Franc ancisco -- by I Inc ncome Poll of Bay Area Travelers, August 2007 9
Feedback: business impacts Top concerns: Effect of fees on business location decisions Impacts of fees on retail sales Commercial fleet and tour bus costs Suggest parking pricing & traffic enforcement could have the same effect 10
MAPS Study Design What scenarios would be feasible and effective? What improvements should be part of the package? What are the potential benefits and impacts? 11
MAPS Analysis of trips in Northeast SF Distribution of AUTO Trips during the PM Peak, 2005 • Nearly half by auto • Over 40% made during peak periods • SF residents make ¾ of car trips Source: SF-CHAMP, 2010 12
Travel Modes to NE SF by Income (pm peak) >150k 2008 Household Income $100-150k Auto $75-100k Transit Walk/Bike $50-75k <50k 0% 20% 40% 60% 80% 100% Person Trips (Percent) SF CHAMP, May 2008 13
Recommended Design: Northeast Cordon Northeast Cordon Cordon bounded by Laguna + 18 th Streets Recommended Pilot Fee: $3 AM/PM peak fee for crossing cordon Recommended discounts: 50% for Disabled Drivers 50% for Zone Residents 50% for Low-income Drivers $6 daily cap $1 rebate on bridge tolls Fleet program for businesses 14
Northeast Cordon performed best Northeast Cordon Benefits: 12% fewer peak period auto trips 21% reduction in VHD 16% reduction in Northeast Cordon GHGs 20-25% transit speed improvement 12% reduction in pedestrian incidents 15
Program Could Generate $60-80M/year Expenditure plan investments included: • Faster, more frequent transit • Street repaving • Traffic calming • Ped + bike improvements • Streetscape enhancements • Parking management + enforcement • TDM programs 16
Health and Safety Benefits Less driving and congestion => Fewer ped & bike injury collisions Less particulate + toxic air pollution => Fewer health impacts for people most vulnerable to pollution More walking and biking => Healthier population 17
Business impacts: broadly neutral • Minimal impact on employment (≤1%) • Neutral to positive impacts on retail sales Photo credits: Flickr users Mark Crawley, Jeffrey Zeldman 18
SF Incentives and Rewards 19
SF Policy and Plan Support SF Transportation Plans (2004 – 2017) SF Climate Action Plans (2004 – 2017) Regional Transportation Plans (2009 – 2017) Transit Center District Plan (2012) Inter-Agency Transportation Demand Management Strategy (2014) Emerging Mobility Evaluation Report (2018) 20
Congestion Pricing around the World Existing pricing systems: Considering pricing: London Los Angeles / Santa Monica • • Stockholm Seattle • • Singapore Vancouver • • Milan Portland • • Gothenburg New York City • • (Sweden) Auckland • 21
What Could be Next? • Refresh MAPS • Effectiveness • Equity • Economy • Confirm design • State legislative authority • Environmental clearance • Implementation 22
Questions? Jeff Hobson jeff.Hobson@sfcta.org San an Franci cisco sco County T ty Transp sporta tati tion A Auth thor ority ty
Recommend
More recommend