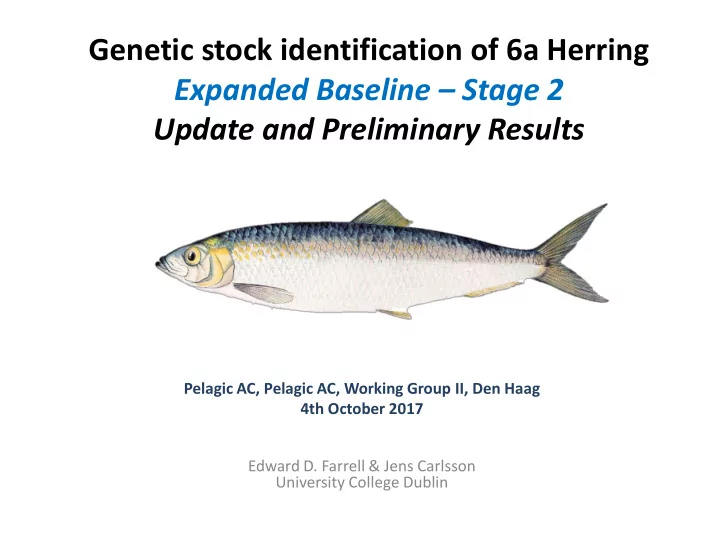

Genetic stock identification of 6a Herring Expanded Baseline – Stage 2 Update and Preliminary Results Pelagic AC, Pelagic AC, Working Group II, Den Haag 4th October 2017 Edward D. Farrell & Jens Carlsson University College Dublin
2017 Progress • Sampling – Completed • DNA extraction – Completed • Genetic marker development – Completed • Sample screening with markers – Completed • Sequencing – Completed • Sequence analyses – Preliminary results • High-graded panel of markers – Preliminary
Stage 2 samples = 1008 (S1) + 1248 = 2256 fish 6aN NS • 2003 • • 2015 2015 • • 2016 (NCW) 2016 • 2016 (NWCW) 6aN (WoH) • 2016 non spawning 6aS • 2003 • 2014 • 2016 • 2017 IS • 2015 CS • Oct_2015 • Dec_2015 • Oct_2016
Expanded Baseline (S2) Marker Panel • 40 microsatellites from Stage 1 • 50 SNPs from Stage 1 • 20 novel microsatellites near informative markers
Sequencing and preliminary analyses • Refined and optimised S1 approach • Sequencing at Earlham Institute, UK • Microsatellites scored using S1 classifier V1.0 • SNP scoring automated with modified scripts from Campbell et al. (2015) • Combined datasets from S1 and S2
Preliminary Microsatellite results • 38/60 microsatellites scored so far • 85,728 genotypes • Baltic (BLT) positive ctrl • Low level genetic difference within S and N spawners • Significantly higher level between S and N • West of Hebrides sample is a mix with more S High IS Mix? Higher Higher Fst-values: 6aS_03 6aS_14 6aS_16 6aS_17 CS_15 CS_16 IS_15 6aN_03 6aN_15 6aN_16 (NCW) 6aN_16 (NWCW) 6aN_16 (WoH) NS_15 NS_16 BLT 6aS_03 0.0030 0.0046 0.0059 0.0070 0.0079 0.0139 0.0154 0.0065 0.0094 0.0170 0.0023 0.0170 0.0134 0.0499 6aS_14 0.0002 0.0016 0.0031 0.0047 0.0154 0.0202 0.0092 0.0131 0.0183 0.0036 0.0214 0.0179 0.0545 6aS_16 0.0030 0.0018 0.0024 0.0142 0.0229 0.0105 0.0157 0.0208 0.0033 0.0244 0.0202 0.0583 6aS_17 0.0082 0.0091 0.0261 0.0192 0.0118 0.0136 0.0171 0.0071 0.0192 0.0197 0.0476 CS_15 0.0007 0.0109 0.0316 0.0155 0.0235 0.0302 0.0069 0.0353 0.0255 0.0729 CS_16 0.0088 0.0285 0.0130 0.0214 0.0276 0.0061 0.0325 0.0241 0.0710 Low IS_15 0.0304 0.0123 0.0204 0.0284 0.0085 0.0349 0.0211 0.0841 6aN_03 0.0022 0.0017 -0.0004 0.0118 -0.0014 0.0013 0.0279 6aN_15 0.0006 0.0025 0.0024 0.0045 0.0009 0.0407 6aN_16 (NCW) 0.0016 0.0070 0.0021 0.0034 0.0355 6aN_16 (NWCW) 0.0105 0.0008 0.0047 0.0305 6aN_16 (WoH) Low 0.0149 0.0124 0.0534 Low NS_15 0.0026 0.0264 NS_16 0.0364 BLT
Preliminary Microsatellite results • Sample clustering • Southern samples grouping • Northern samples grouping • West of Hebrides mixed sample Fst-values: 6aS CS IS 6aN WoH NS BLT 6aS 0.0037 0.0161 0.0165 0.0034 0.0200 0.0489 1 CS 0.0089 0.0265 0.0065 0.0311 0.0667 2 IS 0.0257 0.0085 0.0307 0.0786 3 4 6aN 0.0091 0.0013 0.0332 5 WoH 0.0137 0.0497 NS 0.0301 6 BLT 7
Preliminary SNP results • 16/50 SNPs scored so far • 36,096 genotypes • Baltic (BLT) positive ctrl • Low level genetic difference within 6aS and 6aN spawners • Significantly higher level between 6aS and 6aN • West of Hebrides sample is a mix with more S CS & IS High Mix? Higher Higher Fst-values: 6aS_03 6aS_14 6aS_16 6aS_17 CS_15 CS_16 IS_15 6aN_03 6aN_15 6aN_16 (NCW) 6aN_16 (NWCW) 6aN_16 (WoH) NS_15 NS_16 BLT 6aS_03 0.0092 0.0273 0.0530 0.2677 0.2152 0.2278 0.2503 0.1771 0.2006 0.2371 0.0564 0.2380 0.2081 0.3463 6aS_14 0.0040 0.0814 0.1528 0.1211 0.1473 0.2599 0.1819 0.2034 0.2515 0.0411 0.2445 0.2130 0.4004 6aS_16 0.1276 0.1071 0.0812 0.1190 0.2655 0.1760 0.1936 0.2524 0.0299 0.2458 0.2100 0.4480 6aS_17 0.3735 0.3210 0.3362 0.3508 0.3086 0.3453 0.3602 0.1849 0.3500 0.3284 0.2809 CS_15 -0.0004 0.1405 0.4731 0.3336 0.3113 0.4026 0.1437 0.4214 0.3917 0.7470 CS_16 0.1333 0.4528 0.3100 0.2954 0.3848 0.1164 0.4010 0.3702 0.7191 IS_15 Low 0.4250 0.2628 0.2456 0.3441 0.0725 0.3728 0.3382 0.7620 6aN_03 0.0330 0.0341 0.0026 0.2238 0.0021 0.0121 0.5783 6aN_15 -0.0022 0.0189 0.1115 0.0193 0.0006 0.5652 6aN_16 (NCW) 0.0199 0.1214 0.0198 0.0028 0.5683 6aN_16 (NWCW) 0.1934 -0.0005 0.0074 0.5397 6aN_16 (WoH) 0.1978 0.1560 0.5293 Low NS_15 0.0044 0.5587 Low NS_16 0.5856 BLT
Preliminary SNP results • Sample clustering • No significant difference between 6aN and NS • 6aS, CS and IS differentiated • West of Hebrides mixed sample Fst-values: 6aS CS IS 6aN WoH NS BLT 1 6aS 0.16725 0.15962 0.23754 0.05827 0.22958 0.35228 2 CS 0.13514 0.34951 0.14641 0.40399 0.74277 3 IS 0.28617 0.0725 0.34729 0.76199 4 6aN 0.16644 0.00145 0.5544 5 WoH 0.19265 0.52932 6 NS 0.56864 7 BLT
Further Analyses Required • Analyse individual markers and populations • Some markers likely very informative • Some likely not very informative • Some informative only for certain populations • Some are under selection and some neutral • Test and confirm temporal stability • Final marker panel based on specific stock ID requirements
Summary of Key Points • Are the msats and SNPs showing similar structure? • Yes • Is there a difference between 6aS and 6aN spawners? • Yes • Can we split 6aS from 6aN? • Yes • Is structure temporally stable? • Yes but some inter annual variability within areas
Additional Points • Can we distinguish CS and IS? • Yes but this can be improved further • Is 6aN different from NS? • No evidence of strong structure between them • Can we split mixed stock samples e.g. MSHAS samples? • Identification of West of Hebrides sample as a mix supports this. Further analyses required
Next Steps • Finalise a High-graded panel of markers • Collect more comprehensive 6aS sample set • Sample 2017 survey and fishery • Sample Teelin Bay again in January 2018 • Results of EASME Herring project call? • If EASME application successful • Screen MSHAS samples • Develop the mixed stock analysis model • Develop rapid on board method
Full Genome Sequencing • GENSINC Project • 50 spawning samples from each • 6aS 2016 • CS 2015 • IS 2015 • 6aN 2016 • Clyde 2003 spring spawner • 6aN 2004 spring spawner • 6aN West of Hebrides 2016 • Stock specific genomes • Finer resolution data for future
Recommend
More recommend