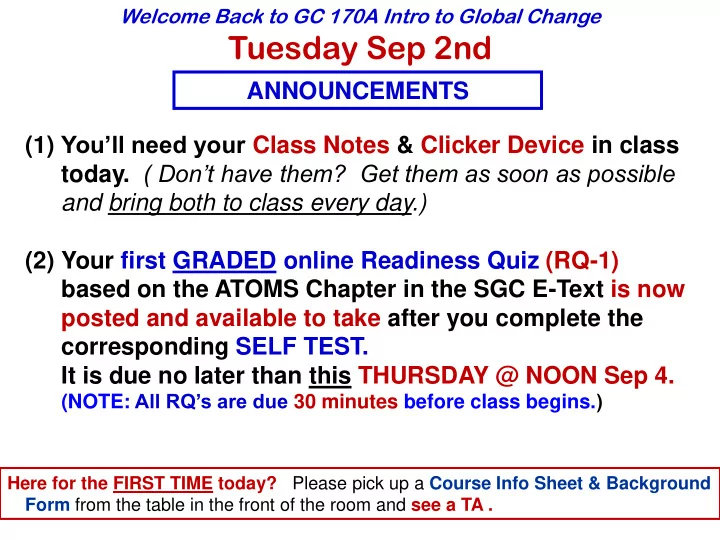

Welcome Back to GC 170A Intro to Global Change Tuesday Sep 2nd ANNOUNCEMENTS (1) You’ll need your Class Notes & Clicker Device in class today. ( Don’t have them? Get them as soon as possible and bring both to class every day.) (2) Your first GRADED online Readiness Quiz (RQ-1) based on the ATOMS Chapter in the SGC E-Text is now posted and available to take after you complete the corresponding SELF TEST. It is due no later than this THURSDAY @ NOON Sep 4. (NOTE: All RQ’s are due 30 minutes before class begins. ) Here for the FIRST TIME today? Please pick up a Course Info Sheet & Background Form from the table in the front of the room and see a TA .
ANNOUNCEMENTS (cont.) (3) CLICKERS /Response Devices will be used for the first time in class today – It’s a PRACTICE DAY today (points won’t go into your Participation grade). BUT BE READY to start using them regularly on Thursday! Directions on how to GET YOUR CLICKER or ResponseWare License are posted In D2 under “Getting Started” and “ Clicker Registration ‘How To’”
ABOUT YOUR TEACHING TEAM
Dr. Katie Hirschboeck Assoc Professor of Climatology Dr. H I STUDY FLOODS! Climate Scientist, Laboratory of Tree-Ring Research & (former chair) Global Change Graduate Interdisciplinary Program Joint appointments: Hydrology & Water Resources, Atmospheric Sciences, Geography & Regional Development, Arid Lands Resource Sciences (Before UA . . . . was on faculty at Louisiana State University) Degrees from: Univ of Wisconsn-Madison (Geography) (B.S. & M.S.) Ph.D. Univeristy of Arizona (Geosciences)
Dr H’s Lab:
Diana Zamora-Reyes Hydrology and Water Resources Main Interest: How does climate manifest itself in the past, present, or future? Synoptic Storm - Speleothems or cave deposits (Junior-UT Austin) - Varves or lake deposits (Senior-Lake Linné, Svalbard) Convective Storm - Floods! (Master’s Thesis; PhD Dissertation) Tropical Cyclone Convective Storm
Scott Jones PhD Major: Arid Lands Resource Sciences Minor: Global Change
THE TEACHING TEAM CONSIDER BEING A PRECEPTOR!
Weekly meetings with Dr H & the TA’s to work on About the class activities together Teaching Team Program & becoming a Preceptor Have FUN! Learn the material better by Facilitate hands on helping your classmates learn activities in class
Why should I Become a Preceptor? • Personal involvement with your course – YOU can help make it a better course through your input • Learn new professional and leadership skills • Learn the material better by helping others learn • Opportunity to excel in the course !! • Get to know your professor & TA’s as mentors and future references for applications, jobs, etc. • Get 3 units credit (Preceptor Course ) OR Honors credit (if signed up for Sec 2)
How do I find out more? See the PRECEPTOR SECTION under TEACHING TEAM on our GC 170A WEBPAGE Then email Dr H to make an appointment for an interview http://www.ltrr.arizona.edu/kkh/natsgc/
TODAY’S CLASS: - Wrap up of Time Series Graphs - Start Topic #3: Review and Overview of the basics of MATTER & ENERGY - Clicker / Response Session Debut!
POP QUIZ ON THE SYLLABUS & FAQ COURSE LOGISTICS
Q1: When is it OK to talk to my classmates during classtime? FAQ # 34 Q2: When should you begin taking RQ-1 (due THIS Thursday) so you are sure to finish it before the “CUTOFF” DEADLINE? FAQ # 23 Q3: What should you do if you need Dr H to sign a grade report for your program, coach, tutor, sorority, fraternity, etc.? FAQ #29
TRIAL RESPONSE TIME! Practice Day: CLICKER POINTS WILL NOT BE COUNTED TODAY ResponseWare Clicker Device Open up your “APP” Older clicker or is OK login to : rwpoll.com ENTER CHANNEL = 28 ENTER SESSION ID = see above
Q1. I am a . . . A. FRESHMAN B. SOPHOMORE C. JUNIOR D. SENIOR E. OTHER
Q2. What is the difference between Time Series Plots A & B below? A. Plot A depicts a constant mean over time, but Plot B does not B. Plot A doesn’t depict any trend, but Plot B does C. Plot A depicts increasing variance over time, but Plot B does not D. Plot A is periodic but Plot B is not E. There is no difference – they are both random plots with no trends 20 7 TIME SERIES PLOT B 6 TIME SERIES PLOT A 5 4 10 >vartr trend 3 2 1 0 0 -1 Index 10 20 30 40 50 60 70 80 90 100 Index 10 20 30 40 50 60 70 80 90
Q2. What is the difference between Time Series Plots A & B below? A. Plot A depicts a constant mean over time, but Plot B does not B. Plot A doesn’t depict any trend, but Plot B does C. Plot A depicts increasing variance over time, but Plot B does not D. Plot A is periodic but Plot B is not E. There is no difference – they are both random plots with no trends 20 7 TIME SERIES PLOT B 6 TIME SERIES PLOT A 5 4 10 >vartr trend 3 2 1 0 0 -1 Index 10 20 30 40 50 60 70 80 90 100 Index 10 20 30 40 50 60 70 80 90
Recommend
More recommend