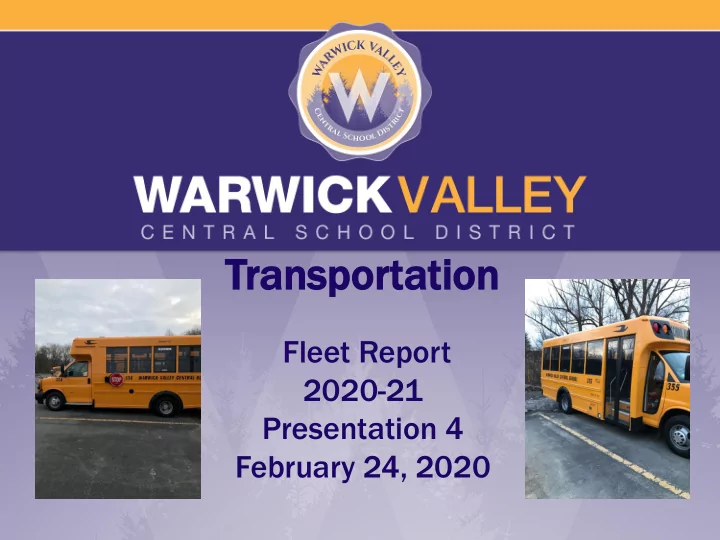

Transp anspor ortation tation Fleet Report 2020-21 Presentation 4 February 24, 2020
Curr rrent ent Fle leet et Siz ize e Type e of V f Vehicle icle # of # f Routes es Spare res s Vehicl icles es 65 Passenger 53 43 10 Propane 13 Gas 37 Diesel 3 60 Passenger 5 5 0 20-30 Passenger 8 5 3 35 Passenger 1 1 0 Wheelchair Bus 5 4 1 9 Passenger Suburban 3 1 2 75 59 16 2
Fl Fleet et Age e Year ar Age ge Cou ount nt Percen rcent t of f Fleet t 2004 16 2 2.7% 2005 15 7 9.3% 2006 14 4 5.3% 2007 13 8 10.7% 2008 12 6 8.0% 2009 11 6 8.0% 2010 10 5 6.7% 2011 9 3 4.0% 2012 8 4 5.3% 2013 7 4 5.3% 2014 6 1 1.3% 2015 5 9 12.0% 2016 4 5 6.7% 2017 3 5 6.7% 2018 2 0 0% 2019 1 0 0% 2020 0 6 8.00% Total 75 100% 3
Fl Fleet et Age e Fle leet et Years s Count t Perc rcentage e Fleet 15 years or older 9 12.0% Fleet 10 years or older 38 50.7% Fleet Under 10 Years 37 49.3% Fleet 5 years to 9 years 21 28.0% Fleet Under 5 years 16 21.3% 62.7% of our fleet is over 10 years old 4
Fl Fleet eet Mi Mileage leage Mileage Count t Perc rcent t Over 150,000 24 32% 100,000 – 149,999 15 20% 50,001 - 99,999 14 18.7% Under 50,000 22 29.3% 75 100% 52% of our fleet has over 100,000 miles, 32% has over 150,000 miles 5
Fle leet et Maint intenance enance Vehicl icle e Age e Ave verage e Mil iles s Avg. . Cost t Per r Mil ile e Total otal Yearly ly Cost t 10 years or over 11,000 $2.35 $25,850 Under 10 years 11,000 $1.89 $20,790 Difference .46 Cents $5,060 Total Cost # of Buses Avg. Yearly Cost Total Costs 10 years or older 38 $25,850 $982,300 Under 10 Years 37 $20,790 $769,230 75 75 $1,7 ,751,53 530 0 6
Bus R Bu s Rou outes es 2019-20 20 202 020-21 21 Total Bus Routes # of Routes # of Routes 65/60 passenger 48 47 20-30 passenger 5 5 35 passenger 1 1 15/21 WC Bus 4 2 9 passenger 1 0 Permanent Subs 5 5 Total 64 60 To reduce 4 routes for 2020-21, the bell times for the Elementary Schools will have to be 10 minutes later. 7
Spare/St are/Standb andby y Bus uses es Vehicl icle e Type e # # of s f spare res s 65 passenger 10 60 passenger 0 20-30 passenger 3 15/21 passenger WC bus 1 9 passenger 2 16 Spare buses are used daily on bus routes when a bus is being serviced/repaired, inspected for DOT, or used for athletic or curriculum trips 8
Bus R Bu s Repla placem cement ent Sc Sche hedu dule le Three Factors that determine when a bus needs to be replaced: 1) Age of Bus ( How old is the bus?) 2) Miles (How many miles are on the bus?) 3) Condition (What is the bus condition?) We try to keep a bus in service between 13-15 years but the number of miles and condition plays a larger role in its replacement. 9
Why y do o we p e purch rchase ase buse ses s ever ery y yea ear? r? We have a fleet of 75 buses. Replacing 5 buses each year would mean the buses being replaced are 15 years old. (75/5=15). The District needs to purchase a minimum of 5 buses each year to maintain safe and efficient bus fleet. 10
BUSES S NEEDING G TO O BE E BUSES NEEDING TO BE REPLAC ACED D REPLACED BUS # CAPACITY CONDITION Year AGE MILEAGE 275 65 SEVERE RUST/HIGH MILES 2004 16 168,972 276 65 SEVERE RUST/HIGH MILES 2004 16 188,691 277 65 SEVERE RUST/HIGH MILES 2005 15 160,504 278 65 SEVERE RUST/HIGH MILES 2005 15 151,638 280 65 SEVERE RUST/HIGH MILES 2005 15 195,230 281 65 SEVERE RUST/HIGH MILES 2005 15 190,608 283 65 SEVERE RUST/HIGH MILES 2005 15 168,221 284 65 SEVERE RUST/HIGH MILES 2005 15 201,141 11
2020-2021 Example of proposed bus purchase - POWEREDBY PROP ANt e nu e Count t Type e of f Bus s Cost t Total otal 3 65 Passenger Propane $123,240.43 $369,721.29 Powered Bus 2 65 Passenger Gas Powered Bus $113,375.48 $226,750.96 5 $596,472.25 12
Transportation Costs - Funding purchase 5 buses Financing g Total Cost of Buses (5 buses) $596,472.25 Transportation Aid 58.5% $348,936.00 Net Cost $247,536.25 Bus Reserve $300,000.00 Additional Cost to Taxpayers $0 13
FLEET WARRANTY Five year warranty on transmission Standard Extended Engine Warranty Available for approximately $3,300 - $4600 per bus. 14
Recommend
More recommend