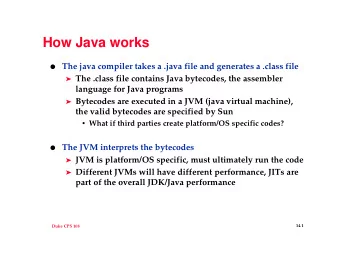
Top 10 Issues for Java in Production SriSatish Ambati Cliff Click - PowerPoint PPT Presentation
Top 10 Issues for Java in Production SriSatish Ambati Cliff Click Jr. Azul Systems, Inc A Decade of Java in Production A lot of hard-earned wisdom A lot of victories (quickly forgotten) A lot of endless pain points Usually
Top 10 Issues for Java in Production SriSatish Ambati Cliff Click Jr. Azul Systems, Inc
A Decade of Java in Production • A lot of hard-earned wisdom • A lot of victories (quickly forgotten) • A lot of endless pain points • Usually the Pain Point is really A Systems Issue • It's Not Just the JVM (nor network, nor ...)
Tools of the Trade • What the JVM is doing: – dtrace, hprof, introscope, jconsole, visualvm, yourkit, azul zvision • Invasive JVM observation tools: – bci, jvmti, jvmdi/pi agents, logging • What the OS is doing: – dtrace, oprofile, vtune • What the network/disk is doing: – ganglia, iostat, lsof, nagios, netstat
Tools of the Trade
10 - Instrumentation is Not Cheap • Symptom – Production monitoring can be very expensive Staging environment does not repro issues – Instrumented code changes cache profile – MBeans are not cheap either! • Solutions – Pick the right axe for the problem! – Avoid expensive heap walks – Finish task then increment perf counters – Asynchronous logging, jconsole, azul zvision
9 - Leaks • Symptom – App consumes all the memory you got – Live Heap trend is a ramping sawtooth – Then slows, then throws OutOfMemory • Tools – yourkit, hprof, eclipse mat, jconsole, jhat, jps, visualvm, azul zvision • Theory – Allocated vs Live Objects, vm memory, Perm Gen – Finalizers, ClassLoaders, ThreadLocal
Leaks: jconsole • Tomcat + ActiveMQ – 1 week in production – after 9hrs in test – Leaks 100MB/hr
Leaks: Visual VM 14741 classes loaded ClassLoader leak, PermGen full
9 – Leaks: Bloat • Cost of an 8-char String? 8b 12b 4b A: 56 bytes, or a 7x blowup hdr fields ptr 8b 4b 16b 4b hdr len data pad • Cost of 100-entry TreeMap<Double,Double> ? 48b TreeMap 100 40b TreeMap$Entry 100 100 16b 16b A: 7248 bytes or a ~5x blowup Double Double
JEE is not cheap! JBoss & Apache startup Million Objects - 20M objects before starting the app allocated live JBoss 5.1 20 4 Apache Tomcat 6.0 0.25 0.1 JBoss 5.1 Apache Tomcat 6.0 Allocated Allocated Class name Size (B) Count Avg (B) Class name Size (B) Count Avg (B) Total 1,410,764,512 19,830,135 71.1 Total 21,580,592 228,805 94.3 char[] 423,372,528 4,770,424 88.7 char[] 4,215,784 48,574 86.8 byte[] 347,332,152 1,971,692 176.2 byte[] 3,683,984 5,024 733.3 int[] 85,509,280 1,380,642 61.9 Built-in VM methodKlass 2,493,064 16,355 152.4 java.lang.String 73,623,024 3,067,626 24 Built-in VM constMethodKlass 1,955,696 16,355 119.6 java.lang.Object[] 64,788,840 565,693 114.5 Built-in VM constantPoolKlass 1,437,240 1,284 1,119.30 java.util.regex.Matcher 51,448,320 643,104 80 Built-in VM instanceKlass 1,078,664 1,284 840.1 java.lang.reflect.Method 43,374,528 301,212 144 java.lang.Class[] 922,808 45,354 20.3 java.util.HashMap$Entry[] 27,876,848 140,898 197.9 Built-in VM constantPoolCacheK 903,360 1,132 798 Live java.util.TreeMap$Entry 22,116,136 394,931 56 java.lang.String 753,936 31,414 24 java.util.HashMap$Entry 19,806,440 495,161 40 java.lang.Object[] 702,264 8,118 86.5 java.nio.HeapByteBuffer 17,582,928 366,311 48 java.lang.reflect.Method 310,752 2,158 144 java.nio.HeapCharBuffer 17,575,296 366,152 48 short[] 261,112 3,507 74.5 java.lang.StringBuilder 15,322,128 638,422 24 java.lang.Class 255,904 1,454 176 java.util.TreeMap$EntryIterator 15,056,784 313,683 48 int[][] 184,680 2,032 90.9 java.util.ArrayList 11,577,480 289,437 40 java.lang.String[] 173,176 1,746 99.2 java.util.HashMap 7,829,056 122,329 64 java.util.zip.ZipEntry 172,080 2,390 72 java.util.TreeMap 7,754,688 107,704 72
example: yourkit memory profiling Know footprint: use memory profiling! (snapshots are still expensive)
Got Leaks?
8 – I/O: Serialization • Symptom – Multi-node scale-out does not scale linearly – Time in both CPU and I/O (serialization costs) • Tools –Cpu profiling, I/O profiling • Solution – All serialization libraries are not equal! – Pick a high performance serialization library or roll-your-own – Avro, kryo, protocol-buffers, thrift
8 – I/O: Limits, Tuning • Symptom – Application hangs or remote call fails after awhile – “Too many open File Descriptors”, “Cursors” – Inconsistent response times • Tools – nagios, pkg, rpm info, ulimit, yum • Solutions – Check for “new” OS patches, user & process limits, network & semaphore configurations – Close all I/O streams – Maybe you are I/O bound!
8 – I/O: Sockets, Files, DB • Symptoms – Socket.create/close takes too long – JRMP timeouts, long JDBC calls – Running out of file descriptors, cursors, disk • Tools – dbms tools, du, iostat, gmon, lsof, netstat • Workaround – Check all O/S patches, sysctl flags, run ping/telnet test – Check & set SO_LINGER, TCP_LINGER2
8 - I/O
7 – Locks & synchronized • Symptoms – Adding users / threads / CPUs causes app slow down (less throughput, worse response) – High lock acquire times & contention – Race conditions, deadlock, I/O under lock • Tools – d-trace, lockstat, azul zvision • Solution – Use non-blocking Collections – Striping locks, reducing hold times, no I/O
Example: IBM Visual Analyzer (j.u.c view in eclipse) Zillion threads acquiring same lock j.u.c.ConcurrentLock is still a lock! Need a non-blocking collection (or stripe lock or lower hold times, etc)
Example: zvision Hot lock is usually 10x to 100x more acquire time than next lock.. Look for rapidly growing acquire times!
Example: zvision Hot Lock Backtrace
6 – Endless Compilation • Symptom – Time “compiling” – Time in the Interpreter • Tools – -XX:+PrintCompilation, cpu profiler – Find endlessly-recompiling method • Workaround – Exclude using .hotspot_compiler file • Root cause: It's a JVM Bug! File a bug report!
5 – Endless Exceptions • Symptom – Application spends time in j.l.T.fillInStackTrace() • Tools – Cpu profiler, azul zvision – Thread dumps (repeated kill -3, zvision) – Track caller/callee to find throw'r • Not all exceptions appear in log files • Solution – Don't Throw, alternate return value (e.g. null)
5 – Endless Exceptions • Related – Exception paths are typically failure paths – JVMs do not to optimize them much – Often found when a server collapses
4 - Fragmentation • Symptom – Performance degrades over time – Inducing a “Full GC” makes problem go away – Lots of free memory but in tiny fragments • Tools – GC logging flags, e.g. for CMS -XX:PrintFLSStatistics=2 -XX:+PrintCMSInitiationStatistics
4 - Fragmentation • Tools – “Fragger” www.azulsystems.com/resources • Tiny cpu cost, low memory cost • Frag's heap in 60sec like an hour in production • Get FullGC cycles at dev's desk • Solution – Upgrade to latest CMS (CR:6631166) – Azul Zing & Gen Pauseless GC – Pooling similar sized/aged objects • (really hard to get right!)
3 – GC Tuning • Symptom – Entropy(gc) == number_of_gc_flags • Too many free parameters • 64-bit/large heap size is not a solution – Constant 40-60% CPU utilization by GC – Scheduled reboot before full-GC – Full time Engineer working GC flags; • Workarounds – Ask JVM Vendor to give 1 flag solution – G1 GC, Azul’s Zing GPGC
3 – GC Tuning Oracle Weblogic GC Flags -server -Xloggc:gc.log -XX:+PrintGCDetails -XX:+PrintGCTimeStamps -XX:MaxPermSize=128m -XX:+UseParNewGC -XX:+UseConcMarkSweepGC -XX:MaxNewSize=64m -XX:NewSize=64m -Xms1536m -Xmx1536m -XX:SurvivorRatio=128 -XX:MaxTenuringThreshold=0 -XX:CMSInitiatingOccupancyFraction=60 -Dsun.rmi.dgc.server.gcInterval=0x7FFFFFFFFF FFFFFE -Dsun.rmi.dgc.client.gcInterval=0x7FFFFFFFFF FFFFFE
2 - Spikes • Symptoms – Rush hour traffic, tax day, Black Friday – Outages under spikes, power law of networks • Solution – Measure . – Test with realistic load & realistic multi-node setup – Build redundancy & elasticity into infrastructure – Don’t ignore Exceptions & retries under load
Busiest online day is...
1 – Versionitis When ears wage class wars with jars • Symptom – Different nodes have different configurations, different stack components, versions – classpath has dist/*, -verbose:class – subtle hard to reproduce issues • Solution – Method. Version Control. – Good ol’ fashioned rigor “It can only be attributable to human error” - HAL
0 – Collapse Under Load (pick any 3 above!) • Runs fine as load Ramps Up – At peak load, system is unstable – Slightly above peak: Collapse! • Heavy load triggers exception (e.g. timeout) • Exception path is slow already (e.g. logging) • Transaction retried (so more work yet again) • So NEXT transaction times-out • Soon all time spent throwing & logging exceptions • No forward progress
example: Driving into San Francisco
Recommend
More recommend
Explore More Topics
Stay informed with curated content and fresh updates.
