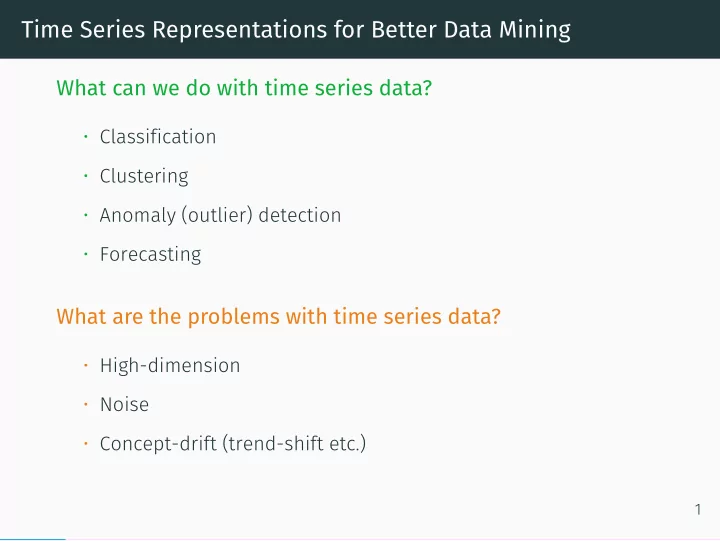

Time Series Representations for Better Data Mining What can we do with time series data? • Clustering • Anomaly (outlier) detection • Forecasting What are the problems with time series data? • Noise • Concept-drift (trend-shift etc.) 1 • Classification • High-dimension
Time Series Representations What can we do for solving these problems? They are excellent to: • Accelerate subsequent machine learning algorithms. • Implicitly remove noise from the data. • Emphasize the essential characteristics of the data. • Help to find patterns in data (or motifs). 2 • Use time series representations! • Reduce memory load.
3 4.75 4.50 Load 4.25 4.00 0 500 1000 Time 4.8 4.6 Load 4.4 4.2 4.0 0 50 100 150 Length 4.8 4.6 Load 4.4 4.2 4.0 0 50 100 150 Length
4 4.75 4.50 Load 4.25 4.00 0 500 1000 Time 4.6 4.6 4.5 Load Load 4.4 4.4 4.3 4.2 4.2 0 10 20 30 40 50 0 100 200 300 Length Length
TSrepr TSrepr - CRAN 1 , GitHub 2 • Large amount of various methods are implemented • Several useful support functions are also included • Easy to extend and to use data <- rnorm(1000) repr_paa(data, func = median, q = 10) 1 https://CRAN.R-project.org/package=TSrepr 2 https://github.com/PetoLau/TSrepr/ 5 • R package for time series representations computing
All type of time series representations methods are implemented, so far these: • PAA - Piecewise Aggregate Approximation ( repr_paa ) • DWT - Discrete Wavelet Transform ( repr_dwt ) Additional useful functions are implemented as: • Windowing ( repr_windowing ) • Matrix of representations ( repr_matrix ) 6 • DFT - Discrete Fourier Transform ( repr_dft ) • DCT - Discrete Cosine Transform ( repr_dct ) • PIP - Perceptually Important Points ( repr_pip ) • SAX - Symbolic Aggregate Approximation ( repr_sax ) • PLA - Piecewise Linear Approximation ( repr_pla ) • Mean seasonal profile ( repr_seas_profile ) • Model-based seasonal representations based on linear model ( repr_lm ) • FeaClip - Feature extraction from clipping representation ( repr_feaclip ) • Normalisation functions - z-score ( norm_z ), min-max ( norm_min_max )
Usage of TSrepr mat <- "some matrix with lot of time series" mat_reprs <- repr_matrix(mat, func = repr_lm, args = list(method = "rlm", freq = c(48, 48*7)), normalise = TRUE, func_norm = norm_z) mat_reprs <- repr_matrix(mat, func = repr_feaclip, windowing = TRUE, win_size = 48) clustering <- kmeans(mat_reprs, 20) 7
1 2 3 4 4 2 3 2 2 2 1 1 1 0 0 0 0 −1 −1 −1 −2 5 6 7 8 3 3 2 2 2 2 1 1 1 1 0 0 0 0 −1 −1 Regression Coefficients −1 −2 −1 −2 −3 9 10 11 12 4 4 2 2 2 2 0 0 0 0 −2 −2 −2 13 14 15 16 2 2 2 2 1 1 0 0 0 0 −1 −1 −2 −2 −2 −2 17 18 19 20 3 3 2 2 4 2 1 1 1 0 2 0 0 −1 −1 0 −1 −2 −2 −2 0 20 40 0 20 40 0 20 40 0 20 40 Length
1 2 3 4 1.5 1.0 1.0 1 1 0.5 0.5 0.0 0 0 0.0 −0.5 −0.5 −1.0 5 6 7 8 1.0 2 2 0.5 0.5 1 0.0 1 0.0 −0.5 −0.5 0 0 −1.0 −1.0 −1.5 Normalized Load 9 10 11 12 5 1.0 4 0.5 0.25 3 0.5 0.00 0.0 2 0.0 1 −0.25 −0.5 −0.5 0 −1.0 −0.50 13 14 15 16 1.0 1.0 1.0 1 0.5 0.5 0.5 0.0 0.0 0.0 0 −0.5 −0.5 −0.5 −1.0 −1.0 −1.0 −1 17 18 19 20 1.5 1.0 0.5 1 1.0 0.5 0.0 0.5 0 0.0 −0.5 0.0 −1 −1.0 −0.5 −0.5 0 250 500 750 1000 0 250 500 750 1000 0 250 500 750 1000 0 250 500 750 1000 Time
Simple extensibility of TSrepr Example #1: library(moments) data_ts_skew <- repr_paa(data, q = 48, func = skewness) Example #2: repr_fea_extract <- function(x) c(mean(x), median(x), max(x), min(x), sd(x)) data_fea <- repr_windowing(data, win_size = 100, func = repr_fea_extract) 10
Conclusions Time Series Representations: • Implemented in TSrepr Questions: Peter Laurinec tsreprpackage@gmail.com Code: https://github.com/PetoLau/TSrepr/ More research: https://petolau.github.io/research Blog: https://petolau.github.io 11 • They are our fiends in clustering, forecasting, classification etc. And of course: install.packages("TSrepr")
Recommend
More recommend