Time Series Data Visualization Class 2, Part A 2 1 Time Series - PDF document
Large Scale Information Visualization Jing Yang Fall 2007 1 Time Series Data Visualization Class 2, Part A 2 1 Time Series Data Fundamental chronological component to the data set Random sample of 4000 graphics from 15 of
Large Scale Information Visualization Jing Yang Fall 2007 1 Time Series Data Visualization Class 2, Part A 2 1
Time Series Data � Fundamental chronological component to the data set � Random sample of 4000 graphics from 15 of world’s newspapers and magazines from ’74- ’80 found that 75% of graphics published were time series − Tufte 3 From John Stasko’s class slides Datasets � Each data case is likely an event of some kind � One of the variables can be the date and time of the event � Examples: sunspot activity, baseball games, medicines taken, cities visited, stock prices, newswires, network resource measures 4 Partially From John Stasko’s class slides 2
Time Series Visualization Approaches � Small Multiples � Time-Series Plot � Static State Replacement (Animation) � Nested Visualization (embed time-series plot into other display) � Brushing and linking 5 Small Multiples � Small multiples are sets of thumbnail sized graphics on a single page that represent aspects of a single phenomenon. They: � Depict comparison, enhance dimensionality, motion, and are good for multivariate displays � Invite comparison, contrasts, and show the scope of alternatives or range of options � Must use the same measures and scale. � Can represent motion through ghosting of multiple images � Are particularly useful in computers because they often permit the actual overlay of images, and rapid cycling. Graphics and Web Design Based on Edward Tufte's Principles, Larry Gales, Univ. of Washington 6 3
Small Multiples Three air pollutants in six counties in southern California Los Angeles Times, 1979 7 Shape Coding Beddow J.: ‘Shape Coding of Multidimensional Data on a 8 Mircocomputer Display’, Visualization ‘90, 1990, pp. 238-246. 4
Time Series Plot Inclinations of the planetary orbits as a function of time Part of a text of monastery schools, tenth century 9 Time Series Plot 10 5
Time Series Plot 11 Time Series Plot 12 6
Time Series Plot 13 Paper: ThemeRiver: Visualizing Theme Changes Over Time [Havre et al. Infovis 00] � Background: a user is less interested in document themselves than in theme changes within the whole collection over time � ThemeRiver provides users with a macro- view of thematic changes � Example dataset used: 1990 Associated Press (AP) newswire data 14 7
A histogram depicting thematic changes 15 Problem � The position of a particular theme within the bars may very considerably � Users are required to integrating the themes across time � Improvement :the river and currents metaphor -> ThemeRiver 16 8
ThemeRiver � The river flows from left to right through time � Colored currents flowing with the river narrow or widen to depict the strength of individual topics 17 18 9
19 20 10
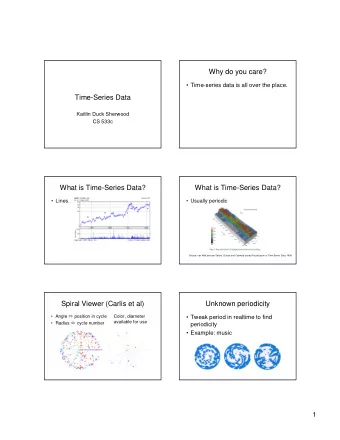
Spiral Graphs History of Italian post office A. Gabaglio, 1888 21 Paper: Visualizing Time-Series on Spirals [weber et al. Infovis 01] 22 11
Features � Scale to large data sets � Support identification of periodic structures in the data � Compare multiple datasets � Use Archimedes’ spiral: r = a Ө � A ray emanating from the origin crosses two consecutive arcs of the spiral in a constant distance 2 π a (equal distance between adjacent periods) 23 Periodic Pattern Identification � Spectrum analysis � Animation 24 12
Multiple Spirals 25 Scales & Legends 26 13
3D Overview and Selection 27 Pixel-Oriented Techniques � Recursive pattern arrangements 28 The figure is taken from Dr. D. Keim’s tutorial notes in Infovis 00 14
Pixel Oriented Techniques � Recursive pattern arrangements 29 The figure is taken from Dr. D. Keim’s tutorial notes in Infovis 00 Nested Visualization � Embed time series plot into other displays Example: Time series plot embedded into a graph Visualization of Graphs with Associated Timeseries Data [Saraiya:05] 30 15
Static State Replacement � Treat time as a dimension hidden from the display � Divide time into period (timeframe, or timepoint) � Generate a visualization for each timeframe � Replace a display of one timeframe using that of another timeframe � Animations, trails 31 Static State Replacement � Example: SPIRE Galaxies display Nowell et al. Infovis 01 32 16
Motivation: Change Blindness � Phenomenon – people do not notice changes in visible elements of a scene � Possible reasons: � Overwriting � Old scene is wholly replaced by the new one � First impressions � Accurately encode details of first scene and fail to encode the details of the changed scene � Nothing is stored � No need to develop any mental representation of the scene � Nothing is compared � Need to focus on changed items to recognition of changes � Feature combination � New scene and old scene are combined together 33 Change Blindness Galaxies slices depicting days 1-3 34 Nowell et al. Infovis 01 17
Change Blindness Themeview slices depicting days 1-3 35 Nowell et al. Infovis 01 Paper: Change Blindness in Information Visualization: A Case Study [Nowell et al. Infovis01] � Portraying document age in Galaxies Visualization � Requirements: � Relative age should be apparent � Newest documents to be seen pre-attentively � Other document ages to be intuitively ordered 36 18
Paper: Change Blindness in Information Visualization: A Case Study [Nowell et al. Infovis01] � Check pre-attentive features: � Spatial layout � Size � Shapes � Angles � Line length � Color progression (such as yellow to green to blue) � Bright to dim progression � Perspective depth � Left to right spatial progression 37 Perspective depth, line and length encoding 38 19
Line angle and length solution 39 Paper: Change Blindness in Information Visualization: A Case Study [Nowell et al. Infovis01] � Candidate solutions for ThemeView � Morphing � What come before, what will eventually appear? � Does not help users remember the changes � Cross-fading � Which part will get brighter, which part will fade away? � Using a wireframe in combination with changes in color and translucency 40 20
Wireframe Solution Moving from one time slice to another with a wireframe and variable translucency. 41 Theme Scan Solution ThemeScan visualization of changes between time slices 42 21
Brushing and Linking � Link time series display with other displays 43 Visualization of Graphs with Associated Timeseries Data [Saraiya:05] Space and Time 44 Napoleon’s army in Russia, author: Charles Minard (1781-1870) 22
Space and Time Life circle of Japanese Beetles L. Newman, Man and Insects, 1965 45 Paper: GeoTime Information Visualization [Kapler and Wright Infovis 04] � A combined temporal-spatial space (X, Y, T coordinate space) � Represent place by 2D plane (or maybe 3D topography) � Use 3rd dimension to encode time 46 23
Paper: GeoTime Information Visualization [Kapler and Wright Infovis 04] 47 Timelines � 3-D Z axis timelines � 3-D viewer facing timelines 48 24
Example 49 Example 50 25
Information Model � Entities � People or things � Locations � Geospatial or conceptual � Events � Occurrences or discovered facts 51 Association Analysis � Expanding search � Connection search 52 26
Other Interactions � Animation of entity � Annotations movements � Drilling down 53 Alternative View � Afghanistan in 2002 � Events in three weeks � Shootings � Bombings � Fires � Mines � Kidnaps � Thefts � assaults 54 27
Paper: Time-Varying Data Visualization Using Information Flocking Boids [Moere Infovis04] � Motivation: users are interested in how data values evolve in time, or in the context of the whole dataset, rather than exact data values � Example: stock price � A company performing significantly better than the day before � A company performing significantly better than the day before 55 Flocking Boids � Boids (bird-objects) within a flock � Boids at the edge of a herb are easier to be selected � Boids attempt to move as close to the center of the herd as possible � Boids view the world from their own perspective rather than from a global one 56 28
Behavior Animation � Each individual member contains its own set of rules and the future state of a member only depends on its neighbors � Rules: � Collision Avoidance � Velocity Matching (move with about the same speed as neighbors) � Data similarity (Stay close to boids experienced similar data value evolution during current timeframe) � Data Dissimilarity (Stay away from boids experienced dissimilar data value evolution) � Flock Centering (move toward the center as the boid perceives it) 57 Example 58 29
Shape 59 References � E. Tufte. The Visual Display of Quantitative Information, 1983 � Papers referred 60 30
Assignment � Present a geo-spatial / time visualization paper in next class 61 31
Recommend


![Databases Picture by Jeremy Hiebert [http://www.flickr.com/photos/jeremyhiebert/] Graph Databases](https://c.sambuz.com/788144/databases-s.webp)
More recommend
Explore More Topics
Stay informed with curated content and fresh updates.