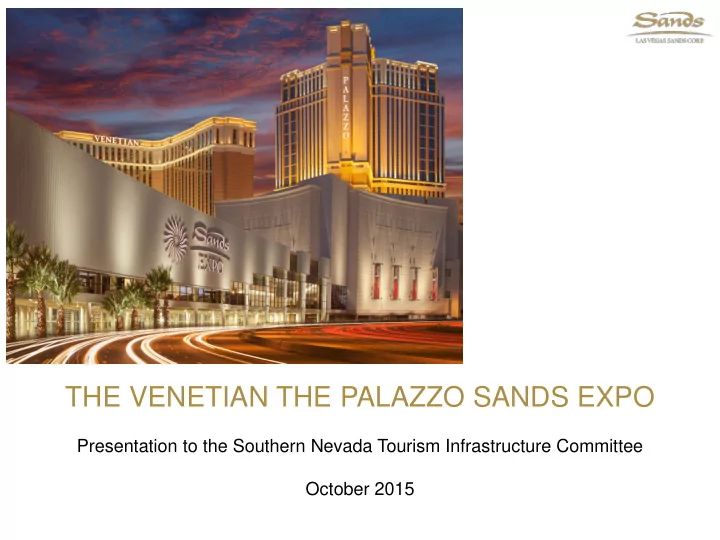

THE VENETIAN THE PALAZZO SANDS EXPO Presentation to the Southern Nevada Tourism Infrastructure Committee October 2015
AGENDA Overview History Operations Community Trend Need 2
OVERVIEW Las Vegas Sands Offers in Las Vegas 2.25 million square feet of flexible exhibition and meeting space Space for groups of varying size and purpose 350 meeting rooms from 342 to 85K Sq. Ft. 5 Exhibit halls from 100K to 1M Sq. Ft. 3
CUSTOMERS 4
ATTENDEES More than 2.3 MILLION annually 5
IMEX 2014 6
AGENDA Overview History Operations Community Trend Need 7
EARLY YEARS 1989: Pre-opening 1991: Comdex (180K Sq. Ft.) 1994: Automotive Aftermarket Ten years after Products Expo (AAPEX) founding COMDEX, Mr. Adelson and his partners bought Sands Hotel 1996 1989 1990 1991 1992 1993 1994 1995 1996: Era Ends with Sands Closing 1990: Opening Year 1993: Computer Electronics Show (CES) 2 nd largest in world Last Apple appearance 8
GROWTH 1999: Venetian Opening 2003: Venezia Opening 2008: Palazzo Opening 1999 2000 2001 2002 2003 2004 2005 2006 2007 2008 1999: Launch Expansion 2005: Third Expansion 2003: Second Expansion Level 1/Level 2 Level 3/4 Level 2 45 meeting rooms 64 meeting rooms 136 meeting rooms 295K Sq. Ft. 204K Sq. Ft. 102K Sq. Ft. 2006: Fourth Expansion Level 5 1 large ballroom 102K Sq. Ft. 9
CURRENT 2010: Shot Show 2012: HIMSS 2014: HP from Big Tech 2010 2011 2012 2013 2014 2015 2015: CES in both LVS and LVCVA 2011: G2E 2012/13: $35M Invested to Go Green 10
AGENDA Overview History Operations Community Trend Need 11
PRIOR TO EXTERIOR AND LOBBY UPGRADE 12
POST EXTERIOR AND LOBBY UPGRADE 2013: 33 Million Dollar Renovation 13
TOUR 14
KITCHEN 2015: $6 Million Dollar Kitchen Renovation 15
TECHNOLOGY Investment $6.2M since 2012 $1.8M in G-hall alone in 2015 Benefits Allows real-time instant connectivity Allows any device to connect Automatically scales for any size event Meets customer demands for Internet of things (IOT) 16
TRAFFIC FLOW Traffic Flow / Accessibility 17
TRAFFIC FLOW 18
TRAFFIC FLOW 19
AGENDA Overview History Operations Community Trend Need 20
ECONOMICS Annual visitation 4.3M visitors $600M in room spend $3B in non-room spend Annual Jobs $360M paid in direct payroll; +9000 direct jobs $500M in indirect payroll; +10,000 indirect jobs Annual Development $500M in development, including procurement Annual public revenue (taxes) $70M of annual impact SOURCE: LVCVA, Las Vegas Sands analysis 21
OUTREACH $7 million gift to the William F. Harrah College of Hotel Administration at UNLV 22
OUTREACH Record Keeping: Catholic Charities transfer donation into their equipment, photographs and track each donation Record Keeping: Catholic Charities takes a photo of final meal to show what is served to their clients. Community Hero Awarded by Three Square Food Bank Over 120,000 Meals donated from banquets Designed the operatives and procedure to rescue food from resorts on the strip 23
LEED Gold Level II Certified under Certified for the APEX/ASTM Existing Buildings Certification Series for in 2010 and were Environmentally recertified in Sustainable Meetings, 2015 Events, Trade Shows, and Conferences 85% Recycle Rate 82% Recycle Rate
OUTREACH Annual outreach impact $0.5M in charitable giving; 50+ institutions $0.3M in employee giving; 4000+ volunteer hours $1M in team member support (e.g. child care subsidies) 25
IMPACT Over $5B in annual socio-economic impact 26
AGENDA Overview History Operations Community Trend Need 27
SPACE OCCUPANCY NOT AT THEORETICAL PEAK Occupied Space, % Not Occupied Occupied 100% PEAK AVG Jan Feb Mar Apr May Jun Jul Aug Sep Oct Nov Dec NOTE: Average represents 2012-2015 28
GROUP RATE NOT AT HISTORICAL PEAK ADR, $ Historical Peak 2005 2006 2007 2008 2009 2010 2011 2012 2013 2014 2015 2016 29
GROUP OCCUPANCY NOT AT THEORETICAL PEAK RN, Thousands Theoretical Peak 2005 2006 2007 2008 2009 2010 2011 2012 2013 2014 2015 2016 30
SUMMARY ROOM TO GROW 12% from theoretical peak space capacity 11% from historical peak group rate (not inflation adjusted) 10% from theoretical peak group room occupancy Untapped potential for multiple location opportunities STRATEGY Invest in our facilities Expand our facilities Improve service Attract new customers Retain existing customers Innovate meeting types Grow multiple location opportunities 31
AGENDA Overview History Operations Community Trend Need 32
NEED Tax dollars should be used to improve infrastructure (e.g. Airport, Transportation) Pedestrian walkways Expansion of roads and access points Improved mass transportation (e.g. light rail) Stadium to attract major sports and city-wide events as well as provide benefit to UNLV Tax dollars should NOT be used to compete with the private sector 33
Recommend
More recommend