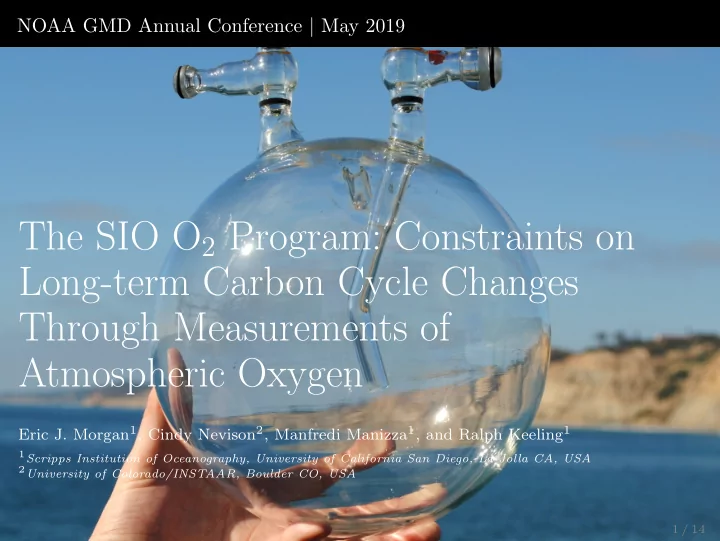

NOAA GMD Annual Conference | May 2019 The SIO O 2 Program: Constraints on Long-term Carbon Cycle Changes Through Measurements of Atmospheric Oxygen Eric J. Morgan 1 , Cindy Nevison 2 , Manfredi Manizza 1 , and Ralph Keeling 1 1 Scripps Institution of Oceanography, University of California San Diego, La Jolla CA, USA 2 University of Colorado/INSTAAR, Boulder CO, USA 1 / 14
The SIO O 2 Program Flask Network 0 400 -500 350 δ (O 2 /N 2 ) [per meg] -1000 CO 2 [ppm] 300 -1500 250 -2000 200 -2500 150 -3000 1990 1995 2000 2005 2010 2015 2020 1990 1995 2000 2005 2010 2015 2020 2 / 14
Global Carbon Budget � (O 2 / N 2 ) sample � × 10 6 δ (O 2 / N 2 ) = − 1 (O 2 / N 2 ) ref APO = δ (O 2 / N 2 ) + α lnd (CO 2 − 350) X O 2 3 / 14
Global Carbon Budget −50 1991 − 2017 −150 ∆CO 2 = F − O − L −250 −350 ∆O 2 = − α F F + α L L + Z eff δ (O 2 /N 2 ) [per meg] −450 −550 ∆CO 2 = atmospheric CO 2 ∆O 2 = atmospheric O 2 −650 F = Fossil fuel emissions O = Net ocean sink −750 L = Net land sink Land α lnd = stoichiometry of terrestrial Atmospheric increase uptake Ocean uptake −850 exchange Fossil fuel emissions −950 α F = stoichiometry of FF burning Z eff = ocean outgassing of O 2 −1050 350 365 380 395 410 425 440 455 CO 2 [ppm] 4 / 14
Global Carbon Budget: Inputs INPUTS - ∆ δ (O 2 /N 2 ) from SIO O 2 Program - ∆CO 2 from SIO O 2 Program and NOAA - F from GCP (CDIAC/BP) - Z eff from NOAA/NCEI ocean heat content 5 / 14
Global Carbon Budget: Inputs 10 gas liquid solid Fossil fuel emissions (PgC yr − 1 ) cement 8 gasflaring Total Preliminary data 6 4 2 0 1990 1995 2000 2005 2010 2015 6 / 14
Global Carbon Budget: Inputs 1990−1999 2000−2009 200 2010−2017 10 Ocean heat content (ZJ) 8 150 Z eff (10 13 mol yr − 1 ) 6 100 4 50 2 0 1990 1995 2000 2005 2010 2015 γ O 2 − X O 2 � � Z eff = γ N 2 Q + Z atmD X N 2 7 / 14
Global Carbon Budget: Results 10 Atmosphere Land Ocean 8 5±0.3 (52%) CO 2 Flux (PgC yr − 1 ) 6 4±0.3 (51%) 3.1±0.3 (50%) 4 1.5±1.3 (15%) 1.1±0.9 (15%) 1.1±0.6 (18%) 2 3.1±1.3 (33%) 2.6±0.8 (34%) 2±0.6 (32%) 0 1990 2000 2010 2018 8 / 14
Global Carbon Budget: Comparisons to Other Estimates 5 This Study Ocean sink (PgCyr − 1 ) GCP 2018 4 DeVries 2014 (OCIM) 3 2 1 0 1990−1999 2000−2009 2010−2017 3 Land sink (PgCyr − 1 ) 2 1 0 1990−1999 2000−2009 2010−2017 9 / 14
APO and the Southern Annular Mode Cape Grim Observatory (CGO), 1991−2018 40 Detrended δ APO (per meg) 20 0 −20 −40 Jan Mar May Jul Sep Nov Jan 10 / 14
APO and the Southern Annular Mode PSA Detrended August δ APO (per meg) CGO SAM 0 −10 −20 −30 SAM Index (reversed axis) −2 −40 −1 0 1 2 1993 1998 2003 2008 2013 2018 11 / 14
APO and the Southern Annular Mode −13 PSA F APO (mol m − 2 yr − 1 ) Detrended August δ APO (per meg) CGO SAM −15 F APO 40−60S 0 −17 −10 −19 −20 −30 SAM Index (reversed axis) −2 −40 −1 0 1 2 1993 1998 2003 2008 2013 2018 F AP O is inferred flux of APO from global atmospheric inversion of SIO data, using the Jena inversion scheme. Data courtesy of C. R¨ odenbeck of MPI-BGC. 12 / 14
Summary - δ (O 2 /N 2 ) and CO 2 -based carbon budgets can constrain the land and ocean uptake over decadal time scales - These data suggest an increasing ocean sink over the 1990–2017 period - Small increase in land sink, but not well resolved given uncertainty - Stations PSA and CGO show wintertime correlations of APO with the Southern Annular Mode - Evidence suggests this is related to Southern Ocean ventilation 13 / 14
Supplemental: Global Carbon Budget Global carbon budget terms, with α lnd = 1 . 1 Term Symbol Unit 1990–1999 2000–2009 2010–2017 ppm yr − 1 CO 2 trend ∆CO 2 1.5 ± 0.1 1.9 ± 0.1 2.3 ± 0.1 per meg yr − 1 APO trend ∆APO − 8 . 0 ± 0.9 − 10 ± 2.0 − 12 ± 3 10 13 mol yr − 1 Ocean O 2 outgassing Z eff 4.1 ± 3 5.2 ± 3 6.6 ± 3 mol mol − 1 OR of fossil fuels α F 1.40 ± 0.06 1.39 ± 0.06 1.37 ± 0.06 Pg C yr − 1 Fossil fuel emissions 6.3 ± 0.07 7.8 ± 0.1 9.6 ± 0.1 F Pg C yr − 1 Atmospheric CO 2 A CO2 3.2 ± 0.3 4.0 ± 0.3 5.0 ± 0.3 Pg C yr − 1 Net land sink L 1.1 ± 0.6 1.2 ± 0.9 1.5 ± 1.3 Pg C yr − 1 Net ocean sink 2.0 ± 0.6 2.6 ± 0.8 3.1 ± 1.3 O 14 / 14
Recommend
More recommend