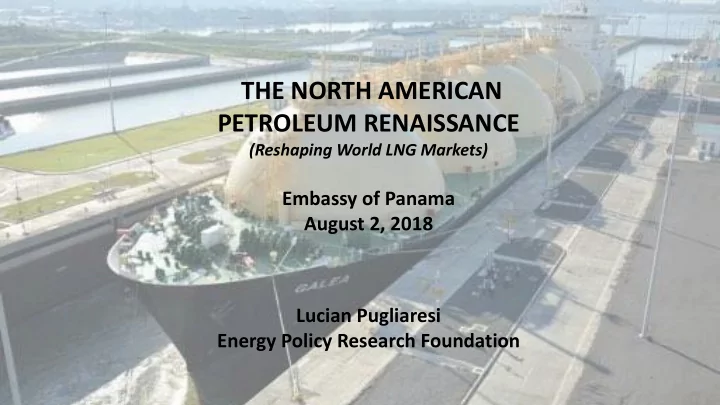

THE NORTH AMERICAN PETROLEUM RENAISSANCE (Reshaping World LNG Markets) Embassy of Panama August 2, 2018 Lucian Pugliaresi Energy Policy Research Foundation
About EPRINC • Founded 1944 • Not-for-profit organization • Studies intersection of petroleum economics and public policy • Provides independent and technical analyses for distribution to the public • Supports USG projects, e.g. Quadrennial Energy Review, DoD strategic outlook • EPRINC Embassy Series • IEEJ-EPRINC Project on “Future of ASIAN LNG • www.eprinc.org 2
EPRINC Embassy Series 3
WES WESTERN ERN INTERI ERIOR R SEA EAWAY Stanley, Steven M. (1999). Earth System History . New York: W.H. Freeman and Company. 4
Main U.S. Shale Basins and Plays Power of Source Rock + Private Property Source: EIA
Permit Activity Williston Basin Powder River Basin DJ Basin (Niobrara Reservoir) Uinta Basin Utica Permian Anadarko Basin Basin (Mississippian, Granite Wash, Mississippi Lime Eagle Ford and other stacked plays) Reservoir Source: HPDI Sept 2014, Past 90 Days 6
Source Rock: Shale Developments
Well Site in the Barnett Shale Play, North Dakota
Source: Completion Design Changes on Well Productivity, Curtis & Montalbano, Forthcoming EPRINC paper, (November 2017). Note: Well productivity indexed to a base curve, which equals 1.
� ��������������������������������������������������������������������������������� ������������ ������� ����� ������ ��������� ������ ��������� �� ���������� ��� ��� �������� ����������������������������������������������������������������������������������� �������� ���� ����� ��� ����������� ���������� ��� ���� ��� ���� ���� ��������� ��� ������ ���� ���������� �������� �� �������� ���������� ����� ����������� ���� ������������� ���� ����� ����������������������������������������������������������������������������� �������������������������������������������������������������������������������� ���������������������������������������������������������������������������������� ���������������������������������������������������������������������������������������� ���������������������������������������������������������������������������������� �������������������������������������������������������������������������������������� U.S. Shales’ Unique Average lead times between final investment decision and first � � � �������������������������������������������������������� Investment Cycle production for different oil resource types ������������������������������������������������� 6 Years Iran Qatar 5 Saudi Nigeria Algeria Arabia 4 Russia Venezuela Canada 3 Norway Brazil 2 Iraq China 1 United States 0 10 20 30 40 50 60 70 80 Reserves developed (billion barrels) Conven �� nal onshore O � shore shallow water Extra-heavy oil and bitumen Tight oil O � shore deepwater �������������������������������������������������������������������������������������������������������������������� The investment cycle for US shale is shorter from that of conventional fields with time ������������������������������������������������������������������������������������������������������������ between FID and first production is a fraction of that for conventional fields (few months) ����������������������������������������������������������������������������������������������������������������� �������������������������������������������������������������������������������������� and much lower capital intensity (few millions dollars) ����������������������������������������������� �������������������������������������������������������������������������������������� ������������������������������������������������������������������������������������ ������������������������������������������������������������������������������������ ����������������������������������������������������������������������������������� ���������������������������������������������������������������������������������� ������������������������������������������������������������������
More Responsive to Price Signals both on Upside & Downside US Crude Production, US Rig Count y/y change, kb/d 1,800 2,000 1,600 1,400 1,500 1,200 1,000 1,000 800 500 600 - 400 200 (500) 0 (1,000) Jan-14 Apr-14 Jul-14 Oct-14 Jan-15 Apr-15 Jul-15 Oct-15 Jan-16 Apr-16 Jul-16 Oct-16 Jan-17 Apr-17 Jul-17 Oct-17 But the response is also fast when prices recover; US shale and been fastest to respond to decline in Reflected in the sharp rise in the rig count and oil price with growth turning negative in 2016 reverse in the declines Source: Baker Hughes, Barclays
U.S. Total Crude and Petroleum Product Trade Million Barrels per Day 2017 Net Imports: 3.7 mbd
NAFTA Total Crude Product Consumption and Production Million Barrels per Day 2017 Net Imports: 1.3 mbd
OUTLOOK FOR US SHALE GAS REMAINS POSITIVE-- LNG FEEDSTOCK PRICES REMAIN LOW 2017 vs 2025 (projected) – CASE STUDY OF THE Haynesville Play FACTORS DRIVING LOW NATURAL GAS COSTS • More frac stages (33), higher proppant volumes (2,500 lbs/ft) • Longer laterals (8,500 ft) will improve Haynesville S Well productivity from 18.4 Bcf in 2017 to 21.2 • Bcf in 2025. Improving well performance and greater drilling • efficiencies counters increases in service costs Thee efficiencies limit Year 2025 “break-even” • costs to $2.60/Mcf compared to $2.50/Mcf in 2017. Source: Vello Kuuskra, Advanced Resources International. Presentation at EPRINC Natural Gas Workshop, Washington, DC. April 19, 2018 .
Recommend
More recommend