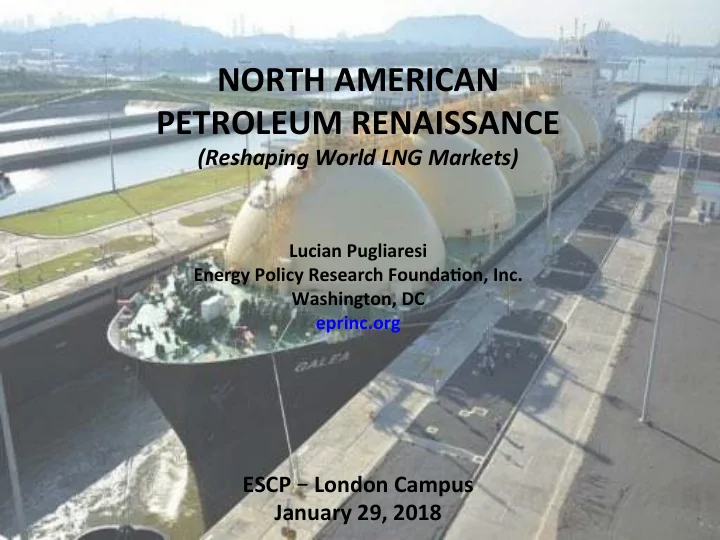

NORTH AMERICAN PETROLEUM RENAISSANCE (Reshaping World LNG Markets) Lucian Pugliaresi Energy Policy Research Founda?on, Inc. Washington, DC eprinc.org ESCP – London Campus January 29, 2018
About EPRINC Founded 1944 • Not-for-profit organiza=on • Studies intersec=on of petroleum • economics and public policy Provides independent and technical • analyses for distribu=on to the public Supports USG projects, • e.g. Quadrennial Energy Review, DoD strategic outlook EPRINC Embassy Series • IEEJ-EPRINC Project on “Future of • ASIAN LNG www.eprinc.org • 2
Before we get started …………………… .. A few words on public finance theory (cost/benefit analysis), net economic value, and the law of diminishing returns
ANWR-Alaska Na?onal Wildlife Refuge Project has high net benefits as it is close to exis?ng transporta?on infrastructure and onshore
Steve McQueen, a San Francisco detective in the iconic thriller, Bullitt, chases the bad guys in his 1968 Ford Mustang GT fastback with a 325 horse power V8. How do the cars of today compare with McQueen’s Mustang? Answer: 1968 Mustang, 1 ton of criteria pollutants per 100,000 miles 2016 Mustang, 10 pounds of criteria pollutants per 100,000 miles
A Comment on Environmental Regula>on How Much Should We Pay for the Last 10 Yards? Annual fuel consumption Annual fuel cost per Grams of Greenhouse Gases per vehicle (assuming vehicle (under two vs Miles Per Gallon (MPG) 12,000 miles per year) price scenarios) 1,000 1,200 Grams of GHGs per Mile You are here $4,000 800 1,000 $3,000 800 600 600 $2,000 400 400 $1,000 200 200 0 0 $0 10 15 20 25 30 35 40 45 50 55 60 65 70 75 80 10 15 20 25 30 35 40 45 50 55 60 65 70 75 80 Miles per Gallon - Increasing Efficiency ---> Miles per Gallon - Increasing Efficiency ---> @$3.50/gal @$2.25/gal GHG/Mile Analysis Based on EPA data Analysis Based on EIA data EPRINC EPRINC Source: Pugliaresi, L. and Max Pyziur, CAFE, Gasoline Prices and the Law of Diminishing Returns, March 2016, EPRINC 6
Dueling Chemistries: BaHeries & Barrels Range Per Pound Of Fuel Source: Courtesy of Mark Mills, Manha[an Ins?tute
Dueling Hardware & Technology Asymptotes Energy Output Per $1 Million CapEx Solar & Wind: Cost per kW Source: Courtesy of Mark Mills, Manha[an Ins?tute
WESTERN INTERIOR SEAWAY Stanley, Steven M. (1999). Earth System History . New York: W.H. Freeman and Company. 9
Main U.S. Shale Basins and Plays Power of Source Rock + Private Property Source: EIA
US Natural Gas Produc?on Source: EPRINC from EIA data
Source: Raymond James, EIA
U.S. Oil Produc?on (millions of barrels/day) Source: EIA
Source: EIA
Source: Comple?on Design Changes on Well Produc?vity, Cur=s & Montalbano, EPRINC paper, (November 2017). Note: Well produc=vity indexed to a base curve, which equals 1.
North American Petroleum Renaissance Needs Pipelines (Incremental Produc?on Must Be Moved to Coastal Processing Centers) Source: CAPP
U.S. Net Trade Crude & Petroleum Products millions bbls/day 16 14 12 total imports 10 US Imports 8 millions bbl/day US Exports US Net Imports 6 net imports total exports 4 2 Note: Of Net Imports of 5.3 mbd, 2.4 mbd from Canada 0 2004 2005 2006 2007 2009 2010 2011 2012 2014 2015 Jul-2016 Source: EIA
NAFTA Single Market Lens (Net Imports of Crude & Petroleum Products) millions bbls/day 12 NAFTA PETROLEUM CONSUMPTION: 22 MMB/D 10 8 total imports NAFTA Imports 6 NAFTA Exports NAFTA Net Imports 4 net imports 2 total exports 0 2004 2005 2006 2007 2009 2010 2011 2012 2014 2015 Jul-2016 Source: EIA
Can LNG Markets Look Like Oil Markets? ……… or at least more like the US Natural Gas Market
U.S. Natural Gas Market is both Prolific and Efficient because........ 1. Resource is vast, distributed among many players, subject to constant cost reduc=ons and technology improvements, rapid infrastructure build-out (except in NY), government oversight is largely (but not always) efficient. 2. The separa=on of pipeline transporta=on services from gas sales 3. Third-party access to pipelines, storage, and LNG terminals 4. Transparency in the repor=ng of gas pipeline capacity u=liza=on, tariffs, and prices at market hubs 5. Broad liquidity in the physical and financial markets Nat Gas consump?on increased from 50 bcf/d in 2005 to 73 bcf/d 2017 and LNG exports are rising
US NATURAL GAS EXPORT COULD GROW QUICKLY trillions cubic feet/year Note: ≈ 4 tcf/yr (11 bcf/d) or 82 MMt on the water By 2030 (maybe) Source: EIA, Reference Case
US LNG Exports Are Growing & Face Challenges billions of cubic feet/day 9 bcf/d = 67.4 MMt LNG in 2020? Source: EIA, projects approved and under construc>on
REGIONAL WORLD NATURAL GAS PRICES ASIA now (Jan 2018) at $10 MMBTU
LNG Short vs. Long Term Range of Uncertainty remains large, almost 100 million tons in 2030 Source: IFC (World Bank)
LNG Demand Growth Requires Growth Outside JKT
How Might Demand Growth Playout to 2030? There’s Still Room for US Exporters Note: By 2020, an es?mated (cumula?ve) 3.0 Bcf/d of contracts will expire, and by 2025 10.4 Bcf/d will expire. Most of these expiring contracts are in Asia Pacific markets. Sources: FTI & ICF, EIA
• Joint Effort IEEJ and EPRINC • Supported by Governments of Japan and U.S. • Policy Proposals Presented in Tokyo (Oct 2017) -- Accepted by both Governments • Discussions on Follow Up Study for 7 th Annual LNG Producer Consumer Mee?ng in Nagoya (October 2018) – Now Underwat
THE END
Recommend
More recommend