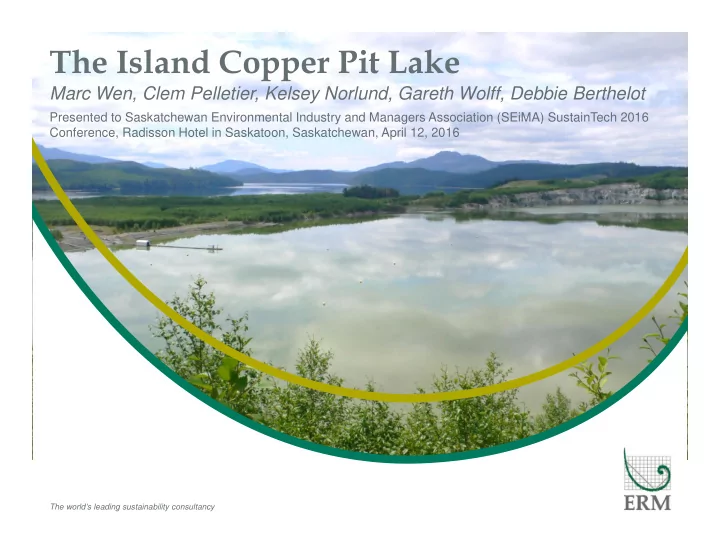

The Island Copper Pit Lake Marc Wen, Clem Pelletier, Kelsey Norlund, Gareth Wolff, Debbie Berthelot Presented to Saskatchewan Environmental Industry and Managers Association (SEiMA) SustainTech 2016 Conference, Radisson Hotel in Saskatoon, Saskatchewan, April 12, 2016 The world’s leading sustainability consultancy
Acknowledgements Authors • Marc Wen, Clem Pelletier, Kelsey Norlund, Gareth Wolff (ERM) • Debbie Berthelot (BHP Billiton) Support from • Steve and Trudy Laccase, Andy Henke, Paul Tupper, Jem Morrison, Mike Soloducha, Ben Beall, Katie Jones, Carol Adly, Fiona Hodge, and many more over many years
Outline • Island Copper Mine • Engineered design of the pit lake • Phytoremediation at the pit lake • Biological response • Biogeochemical response • Discussion and conclusion (what did we learn?)
Island Copper Mine
Island Copper Mine 1995 Operated from 1971 to 1995 1996
Design of Island Copper Pit Lake N E WR WR WR WR WR WR W S
Pit Flooding North Catchment Pit Lake South Catchment Beach Dump Rupert Inlet Middle Layer
ML/ARD Inputs to Pit Lake To surface To middle layer Variable North Catchment Other Southeast Catchment 0.8 Total annual flow 2.0 1.5 (5-yr average; million m 3 ) pH 6.64 - 8.08 3.69 - 8.32 4.30 - 7.83 Conductivity (µs/cm) 726 - 1,220 187 - 2,840 1,210 - 2,302 Sulphate (mg/L) 293 - 638 44.0 - 1,960 653 - 1,621 Dissolved zinc (mg/L) 0.646 - 4.22 0.191 - 23.2 0.564 - 11.1 Dissolved copper (mg/L) 0.0107 - 0.201 0.00823 - 3.78 0.00323 - 2.52 Dissolved cadmium (mg/L) 0.00396 - 0.0234 0.00085 - 0.120 0.0027 - 0.0541
ML/ARD Delivery Systems South Injector System (to 220 m depth) Middle Layer Lifting System
Three-layer Meromictic Lake March 13, 2013 June 11, 2013 September 3, 2013 December 17, 2013 Density ( t) Density ( t) Density ( t) Density ( t) 0 5 10 15 20 25 0 5 10 15 20 25 0 5 10 15 20 25 0 5 10 15 20 25 0 50 100 Depth (m) 150 200 250 300 350
Phytoremediation of the Pit Lake Fertilizer Injection • Treatment required on the surface and at depth • Nutrient amendments from September to June • Commercial-grade liquid fertilizer • N:P ratio of 6:1 by weight • Weekly application of 383 mg N/m 2 and 63 mg P/m 2 • Boat as backup for fertilizer addition
Nutrient Amendments and Mixing 12
Pit Lake Monitoring Program • Water quality (nutrients, metals) • Primary production (chl. a) • CTD casts • ML/ARD quality and input flows
Biological Response Surface to 3 m Depth 150 1.4 1.2 Particulate Zinc (mg/L) Chlorophyll a ( u g/L) 1.0 100 Chlorophyll a Particulate Zinc 0.8 0.6 50 0.4 0.2 0 0.0 2009 2010 2011 2012 2013 Year
Geochemical Response • Metal removal at surface is by adsorption onto organic matter • Export of organic matter from surface to depth • Oxidation by bacteria of organic matter drives redox potential • Three zones • Oxic • Transition • Sulphidic • Metal-sulphide precipitation at depth
Middle Layer Zinc Removal
Conclusions • Designed to be strongly meromictic • Engineered manipulation of upper pycnocline elevation • Three geochemical zones • Two metal attenuation mechanisms: • Metal adsorption in oxic zone • Metal-sulphide precipitation in sulphidic zone
Conclusion 1. Integrated physical biological pit lake design can provide long-lasting and effective treatment system for ML/ARD 2. Site-specific conditions can be challenging, but same conditions can create opportunities for innovation 3. Ignoring the inter-relation between the physical and biological characteristics of a pit lake or future pit lake may lead to non-optimal or unintended results
THANK YOU THANK YOU QUESTIONS? QUESTIONS? 2009 BC Mine Closure Site Tour
Recommend
More recommend