The Impact of COVID-19 on California Transportation Revenues - PowerPoint PPT Presentation
Tab 15 The Impact of COVID-19 on California Transportation Revenues Presentation to the California Transportation Commission Asha Weinstein Agrawal, PhD May 13, 2020 Acknowledgements Co-authors Hannah King and Dr. Martin Wachs (UCLA-ITS)
Tab 15 The Impact of COVID-19 on California Transportation Revenues Presentation to the California Transportation Commission Asha Weinstein Agrawal, PhD May 13, 2020
Acknowledgements • Co-authors Hannah King and Dr. Martin Wachs (UCLA-ITS) • Funding from 2
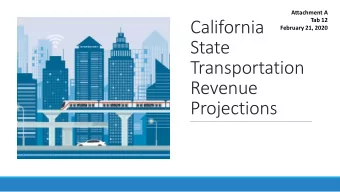
The question: How might COVID-19 affect state-generated transportation revenues through 2030? 3
Taxes and fees projected (SB1 package) Fuel taxes Gasoline excise tax Base excise of 30¢/gallon + swap excise of 17.3¢/gallon (effective 7/1/2019) Diesel excise tax 36¢ per gallon Diesel swap sales tax 5.75% on purchase price Vehicle fees (annual) Transportation Improvement Fee (TIF) $25 - $175; rate depends on vehicle value Road Improvement Fee (RIF) $100 per ZEV (effective 7/1/2020) 4
Methods • Projected state-generated revenue used to fund transportation (SB1 package of gas excise tax, diesel sales and excise taxes, RIF, and TIF) • Used spreadsheet models and readily available data (i.e., US International Energy Agency) • Projected revenue for 5 scenarios + a baseline 5
The scenarios • Compared a “baseline” scenario that assumes a world without COVID-19 to 5 possible recovery scenarios • The scenarios are designed to reflect a range of possible futures (not to predict what will happen) • The scenarios assume different trajectories through 2030 of: ○ Rates of economic recovery affecting fuel consumption and vehicle purchases ○ Levels of policy support to stimulate vehicle purchases, including ZEVs 6
High/medium/low trajectories chosen for key variables in the recovery scenarios: Scenario Variables High-revenue Medium-revenue Low-revenue Gas consumption (volume) Depth of “bottom” (% of pre-COVID-19 weekly consumption) 50% 50% 50% Date recovery begins June 1, 2020 July 1, 2020 August 1, 2020 Date when recovery level is reached Dec. 31, 2021 Dec. 31, 2024 Dec. 31, 2030 Recovery level, as % of pre-COVID-19 consumption 100% 100% 90% Vehicle registrations annual growth rate 1.9% (highest year-to- 0.8% (mean year-to-year 0.5% (lowest year-to- year growth rate for growth rate for 2008 - year growth rate for 2008-2017) 2017) 2008-2017) ZEV registrations annual growth rate Meet CA target of 1.5 +50,000 per year (2018- +15,000 per year million ZEVs by 2025 19 rate) (2014-15 rate) and 5 million by 2030 Vehicle value EIA rate (same as the 5% under EIA rate 10% under EIA rate baseline) 7
Trajectories chosen for key variables in the recovery scenarios: Gas Vehicle ZEV Vehicle Recovery scenarios consumption registrations registrations value Fast w/ZEV stimulus High High High High Moderate Medium Medium Medium Medium Moderate w/ZEV stimulus Medium Medium High Low Moderate w/stagnated vehicle market Medium Low Low Medium Slow Low Low Low Low Note : See table on previous slide for definitions of the high, medium, and low trajectories for each variable. 8
Total revenue, all scenarios (billions of 2020 $s) Mean projected revenue in 2030 ranges from $9.4B to $11.4 B Mean cumulative projected revenue from 2020 to 2030 varies by scenario: ■ Baseline: $118 billion ■ Slow: $98 billion (- 17%) ■ Fast w/ZEV stimulus: $121 billion (+ 3%) Lines = mean projections 9 Shaded bands = range of projected revenue
Total revenue, by source, all scenarios ⯀ Gasoline taxes generate the most revenue in all scenarios ⯀ Scenarios with more ZEVs earn a noticeably higher percent of revenue from vehicle fees (RIF + TIF) Note : In some scenarios, the RIF (on ZEVs) is too small to see 10
Conclusion • Total revenue raised varies considerably among the scenarios. E.g. in 2030: Slow-recovery: $9.4 billion vs. Fast-recovery+ZEV-stimulus: $11.4 billion • Cumulative revenue from 2020 - 2030 varies by more than $20 billion • Gasoline taxes generate the most revenues in all scenarios • User fees levied on ZEVs could potentially replace and or even exceed lost gasoline sales tax revenue 11
Want to learn more? MTI reports The Impact of COVID-19 on California Transportation Revenue May 2020 The Impact of ZEV Adoption on California Transportation Revenue . July 2019 The Future of California Transportation Revenue . October 2018 Email: asha.weinstein.agrawal@sjsu.edu 12
Recommend


More recommend
Explore More Topics
Stay informed with curated content and fresh updates.