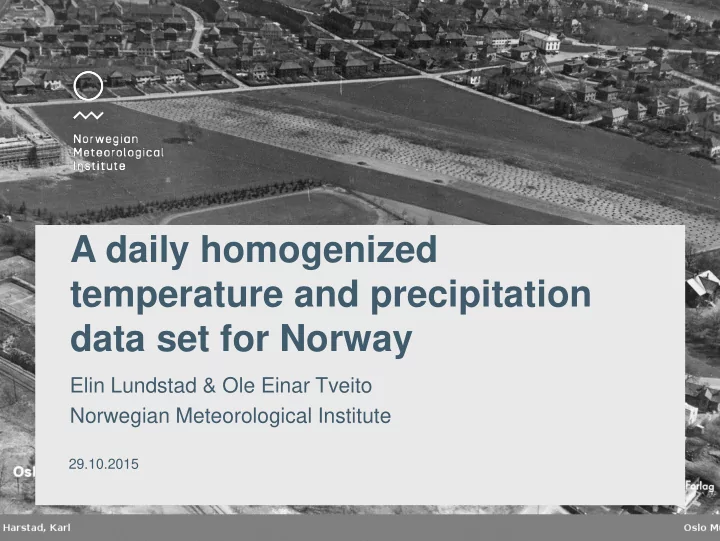

«Fil…» A daily homogenized temperature and precipitation data set for Norway Elin Lundstad & Ole Einar Tveito Norwegian Meteorological Institute 29.10.2015
Norwegian Meteorological Institute 2
Norwegian Meteorological Institute 3
Objectives Establish a quality assurance tools to identify and adjust for homogeneity violation Producing homogenized daily values of temperature and precipitation for a number of long climate series. Develop methodology to generate "homogenized" daily values of precipitation and temperature for given locations / catchments based on gridded (1x1 km) map. Facilitate homogenized daily values and analysis for homogenization so that it is available to external users, such as Statkraft. Norwegian Meteorological Institute 5
Challenges with the methods HOMER Norwegian Meteorological Institute 6
What is new? · Former homogenization of monthly values · Mostly temperature data of some stations · Now homogenization of daily data - and all the precipitation stations · New methods and programs: - SNHT HOMER, MASH, SPLIDHOM, RHtest Norwegian Meteorological Institute 7
Methods Norwegian Meteorological Institute 8
Locations/Network Network Breaks Temperature · 7 stations @Tromsø 1 · 7 @ Trondheim 7 · 12 @ Bergen 3 · 10 @ Kristiansand 3 · 10 @ Oslo 3 or 4? Precipitation · 1 @ Bardufoss 0 · Mo i Rana 0 · Fokstua 8 · Takle 1 · Sauda 0 Norwegian Meteorological Institute 10
Challenges
Network 18700 04440 04780 04930 17150 17850 19400 19710 27450 27500 18700 1.000 0.991 0.993 0.987 0.988 0.899 0.996 0.994 0.988 0.879 04440 0.991 1.000 0.994 0.991 0.981 0.989 0.991 0.986 0.983 0.954 04780 0.993 0.994 1.000 0.993 0.984 0.991 0.991 0.989 0.985 0.960 04930 0.987 0.991 0.993 1.000 0.986 0.991 0.986 0.980 0.984 0.954 17150 0.988 0.981 0.984 0.986 1.000 0.995 0.986 0.983 0.994 0.977 17850 0.899 0.989 0.991 0.991 0.995 1.000 0.992 0.988 0.993 0.972 19400 0.996 0.991 0.991 0.986 0.986 0.992 1.000 0.991 0.986 0.967 19710 0.994 0.986 0.989 0.980 0.983 0.988 0.991 1.000 0.986 0.973 27450 0.988 0.983 0.985 0.984 0.994 0.993 0.986 0.986 1.000 0.976 27500 0.879 0.954 0.960 0.954 0.977 0.972 0.967 0.973 0.976 1.000 Norwegian Meteorological Institute
What causes the breaks? 2011 1969 1924 1982 Norwegian Meteorological Institute 13 1950
From manual to automatic WS Norwegian Meteorological Institute 14
Norwegian Meteorological Institute 15
New buildings Norwegian Meteorological Institute 16
Vegetation grows Norwegian Meteorological Institute 17
Results of the homogenization
Code for intepretation of breaks - Metadata A = Change from manuel to automatic station E = Environment H = Change of instrument height I = Inspection N = New instrument O = Shift of observer R = Relocation S = Change of screening ? = Not confirmed Norwegian Meteorological Institute 19
Norwegian Meteorological Institute 20
A = Change from manuel to automatic station E = Environment H = Change of instrument height I = Inspection N = New instrument O = Shift of observer R = Relocation S = Change of screening ? = Not confirmed Norwegian Meteorological Institute 21
TRONDHEIM Norwegian Meteorological Institute 22
Norwegian Meteorological Institute 23
Bergen FLORIDA Norwegian Meteorological Institute 24
Norwegian Meteorological Institute 25
Norwegian Meteorological Institute 26
Kristiansand Norwegian Meteorological Institute 27
Norwegian Meteorological Institute 28
Norwegian Meteorological Institute 29
Norwegian Meteorological Institute 30
What happen in 1988? Norwegian Meteorological Institute 31
What happen in 1988? Norwegian Meteorological Institute 32
Norwegian Meteorological Institute 33
Norwegian Meteorological Institute 35
The adjustment Norwegian Meteorological Institute 38
Precipitation: RHtestsV4 Norwegian Meteorological Institute 40
Fokstua Norwegian Meteorological Institute 41
Norwegian Meteorological Institute 42
Takle Norwegian Meteorological Institute 43
Experiences so far.. · For temperature, we follow the recommendations of COST HOME: · Homer for monthly temperature · Software: SPLIDHOM for daily temperature · Homogeneity Software precipitation is problematic: Seasonal challenges are not covered by "standard" applications. We use several Homer, MASH, .... One method of day P.T. (RHtests_dlyPrcp4 @ Wang) Have access to other methods (MASH, ACMANT, ...) for comparison (monthly data) Open source can be a challenge: · lack of standardization maintenance and repairs Norwegian Meteorological Institute
Norwegian Meteorological Institute 45
Thanks for your attention! T. +47 22 96 31 69 elinl@met.no E. @nile_2011 Twitter. Norwegian Meteorological Institute
Norwegian Meteorological Institute
Recommend
More recommend